RNSG 2539 SAC Mobility Exam 2 Perfusion, Clotting, Metabolism, & Nutrit
2025
Study online at https://quizlet.com/_hm0ol9
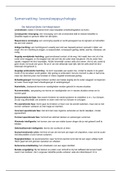
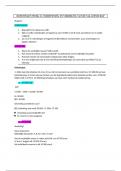
P wave=atrial depolarization
QRS wave=ventricular depolarization
T wave=ventricular repolarization
ECG/EKG strip
P-wave questions:
Are they present?
Do they occur regularly?
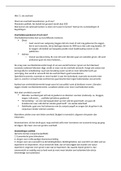
P Wave
The P wave represents atrial depolar- Is there one P-wave for each QRS com-
ization. In a normal EKG, the P-wave plex?
precedes the QRS complex. It looks like
a small bump upwards from the base- Are the P-Waves smooth, rounded, and
line. The amplitude is normally 0.05 to upright?
0.25mV (0.5 to 2.5 small boxes). Nor-
mal duration is 0.06-0.11 seconds (1.5 Do all P-Waves have similar shapes?
to 2.75 small boxes). The shape of a
P-wave is usually smooth and rounded.
The PR Interval indicates AV conduction
time. PR Interval questions to address:
In this step you should measure the in-
terval from where the P wave begins Does the PR-Interval fall within the norm
until the beginning of the QRS com- of *0.12-0.20 seconds?*
plex. Calipers, marked paper or counting
, RNSG 2539 SAC Mobility Exam 2 Perfusion, Clotting, Metabolism, & Nutrit
2025
Study online at https://quizlet.com/_hm0ol9
small boxes methods can be used to de-
termine PR Intervals. Normally this inter-
val is 0.12 to 0.20 seconds (3 to 5 small Is the PR-Interval constant across the
boxes) in adults, longer in elderly peo- ECG tracing?
ple. This interval shortens with increased
heart rate.
Also evaluate if PR Intervals are constant
or varying across the EKG strip. If they
vary, determine if the variations are a
steady lengthening until the point where
an expected QRS does not appear.
The *QRS complex* indicates ventric-
ular depolarization. Depolarization trig-
gers contraction of the ventricles.
Because of the larger tissue mass, the
QRS complex is larger than the P wave.
While the prototypical QRS complex QRS questions:
consists of three wave components, one Does the QRS interval fall within the
or two of these components may be range of *0.06-0.12 seconds?*
missing. Are the QRS complexes similar in ap-
In this step, measure the QRS interval pearance across the ECG tracing?
from the end of the PR interval to the end
of the S wave. Use calipers, marking pa-
per or by counting small boxes. Normally
this interval is 0.06 to 0.12 seconds (1.5
to 3 boxes).
The *T wave* indicates the repolarization
of the ventricles. It is a slightly asym-
metrical waveform that follows (after a
pause), the QRS complex. Take note of T
waves that have a downward (negative)
deflection or of T waves with tall, pointed
peaks.
The U-wave is a small upright, round-
ed bump. When observed, it follows the
T-wave.
, RNSG 2539 SAC Mobility Exam 2 Perfusion, Clotting, Metabolism, & Nutrit
2025
Study online at https://quizlet.com/_hm0ol9
The *QT interval* represents the time of
ventricular activity including both depo-
larization and repolarization.
It is measured from the beginning of the
QRS complex to the end of the T wave.
Normally, the QT interval is 0.36 to 0.44
seconds (9-11 boxes). The QT interval
will vary with patient gender, age and
heart rate. Another guideline is that nor-
mal QT Intervals is less than half of the
R-R Interval for heart rates below 100
bpm.
The *ST segment* represents the early
part of ventricular repolarization.
The ST segment is the line that from the
end of the QRS complex to beginning of
the T wave. Normally the ST segment is
flat relative to the baseline.
For ventricular rhythms, examine the R
to R intervals on the EKG strip. Calipers
or paper marks can be used to fix the
distance for one R-R interval and then
this distance can be compared to other
R-R pairs.
Are they regular, meaning that each
heart beat's R-R interval is equal? Small
Determining Normal vs. Abnormal Atrial
variations of up to 10% are considered
and Ventricular Rhythm
equal. Is the rhythm regularly irregular?
For example is there a pattern, such as
increasing R-R durations? Or perhaps
groups of similar intervals as illustrated
on the right? Or are R-R intervals com-
pletely irregular?
For atrial rhythm, observe the P-P inter-
vals. Are they regular (minor variations
, RNSG 2539 SAC Mobility Exam 2 Perfusion, Clotting, Metabolism, & Nutrit
2025
Study online at https://quizlet.com/_hm0ol9
can be caused by the breath cycle)? If
P-P intervals are irregular, is there a pat-
tern?
Count the number of QRS complexes
over a 6 second interval. Multiply by
The simplest method to determine heart
10 to determine heart rate. This method
rate on an ECG/EKG strip
works well for both regular and irregular
rhythms.
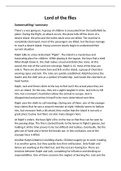
ECG/EKG strip measurements
P Waves are not detectable; sawtooth
pattern in-between QRS complexes.
Atrial Flutter
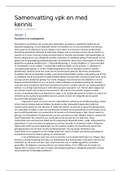
-One or more coronary arteries become
occluded.
-Although there are several possible
causes, arterial occlusion is usually the
result of plaque rupture followed by
thrombus formation. The thrombus then
Myocardial Infarction: Pathophysiology occludes a coronary artery, stopping
blood flow to the heart and depriving the
heart of oxygen, which causes ischemia
that leads to cellular death.
-If coronary occlusion causes ischemia
lasting longer than 45 minutes, irre-
versible myocardial cell damage and
2025
Study online at https://quizlet.com/_hm0ol9
P wave=atrial depolarization
QRS wave=ventricular depolarization
T wave=ventricular repolarization
ECG/EKG strip
P-wave questions:
Are they present?
Do they occur regularly?
P Wave
The P wave represents atrial depolar- Is there one P-wave for each QRS com-
ization. In a normal EKG, the P-wave plex?
precedes the QRS complex. It looks like
a small bump upwards from the base- Are the P-Waves smooth, rounded, and
line. The amplitude is normally 0.05 to upright?
0.25mV (0.5 to 2.5 small boxes). Nor-
mal duration is 0.06-0.11 seconds (1.5 Do all P-Waves have similar shapes?
to 2.75 small boxes). The shape of a
P-wave is usually smooth and rounded.
The PR Interval indicates AV conduction
time. PR Interval questions to address:
In this step you should measure the in-
terval from where the P wave begins Does the PR-Interval fall within the norm
until the beginning of the QRS com- of *0.12-0.20 seconds?*
plex. Calipers, marked paper or counting
, RNSG 2539 SAC Mobility Exam 2 Perfusion, Clotting, Metabolism, & Nutrit
2025
Study online at https://quizlet.com/_hm0ol9
small boxes methods can be used to de-
termine PR Intervals. Normally this inter-
val is 0.12 to 0.20 seconds (3 to 5 small Is the PR-Interval constant across the
boxes) in adults, longer in elderly peo- ECG tracing?
ple. This interval shortens with increased
heart rate.
Also evaluate if PR Intervals are constant
or varying across the EKG strip. If they
vary, determine if the variations are a
steady lengthening until the point where
an expected QRS does not appear.
The *QRS complex* indicates ventric-
ular depolarization. Depolarization trig-
gers contraction of the ventricles.
Because of the larger tissue mass, the
QRS complex is larger than the P wave.
While the prototypical QRS complex QRS questions:
consists of three wave components, one Does the QRS interval fall within the
or two of these components may be range of *0.06-0.12 seconds?*
missing. Are the QRS complexes similar in ap-
In this step, measure the QRS interval pearance across the ECG tracing?
from the end of the PR interval to the end
of the S wave. Use calipers, marking pa-
per or by counting small boxes. Normally
this interval is 0.06 to 0.12 seconds (1.5
to 3 boxes).
The *T wave* indicates the repolarization
of the ventricles. It is a slightly asym-
metrical waveform that follows (after a
pause), the QRS complex. Take note of T
waves that have a downward (negative)
deflection or of T waves with tall, pointed
peaks.
The U-wave is a small upright, round-
ed bump. When observed, it follows the
T-wave.
, RNSG 2539 SAC Mobility Exam 2 Perfusion, Clotting, Metabolism, & Nutrit
2025
Study online at https://quizlet.com/_hm0ol9
The *QT interval* represents the time of
ventricular activity including both depo-
larization and repolarization.
It is measured from the beginning of the
QRS complex to the end of the T wave.
Normally, the QT interval is 0.36 to 0.44
seconds (9-11 boxes). The QT interval
will vary with patient gender, age and
heart rate. Another guideline is that nor-
mal QT Intervals is less than half of the
R-R Interval for heart rates below 100
bpm.
The *ST segment* represents the early
part of ventricular repolarization.
The ST segment is the line that from the
end of the QRS complex to beginning of
the T wave. Normally the ST segment is
flat relative to the baseline.
For ventricular rhythms, examine the R
to R intervals on the EKG strip. Calipers
or paper marks can be used to fix the
distance for one R-R interval and then
this distance can be compared to other
R-R pairs.
Are they regular, meaning that each
heart beat's R-R interval is equal? Small
Determining Normal vs. Abnormal Atrial
variations of up to 10% are considered
and Ventricular Rhythm
equal. Is the rhythm regularly irregular?
For example is there a pattern, such as
increasing R-R durations? Or perhaps
groups of similar intervals as illustrated
on the right? Or are R-R intervals com-
pletely irregular?
For atrial rhythm, observe the P-P inter-
vals. Are they regular (minor variations
, RNSG 2539 SAC Mobility Exam 2 Perfusion, Clotting, Metabolism, & Nutrit
2025
Study online at https://quizlet.com/_hm0ol9
can be caused by the breath cycle)? If
P-P intervals are irregular, is there a pat-
tern?
Count the number of QRS complexes
over a 6 second interval. Multiply by
The simplest method to determine heart
10 to determine heart rate. This method
rate on an ECG/EKG strip
works well for both regular and irregular
rhythms.
ECG/EKG strip measurements
P Waves are not detectable; sawtooth
pattern in-between QRS complexes.
Atrial Flutter
-One or more coronary arteries become
occluded.
-Although there are several possible
causes, arterial occlusion is usually the
result of plaque rupture followed by
thrombus formation. The thrombus then
Myocardial Infarction: Pathophysiology occludes a coronary artery, stopping
blood flow to the heart and depriving the
heart of oxygen, which causes ischemia
that leads to cellular death.
-If coronary occlusion causes ischemia
lasting longer than 45 minutes, irre-
versible myocardial cell damage and