LEE VALLEY TOOLS: OVERSIZED CHALLENGES
CASE STUDY SOLUTION
e
pl
SYNOPSIS
m
Sa
Nick works as the weekend shift supervisor at Lee Valley’s fulfillment centre in Ottawa. The company
operates three shifts—a day and night shift on weekdays and a weekend (day) shift on Saturday and Sunday.
Reviewing performance statistics, he has noted that the night-shift staff in the warehouse is achieving higher
performance in order fulfillment and line-item fulfillment. The performance of the weekend-shift staff is
n
more aligned with that of the day-shift staff, which has to deal with deliveries of incoming items and placing
tio
the items in the warehouse. Nick wonders why the weekend shift seems to lag behind and whether these
differences are significant and meaningful.
lu
Nick finds that there appears to be a lag in the PPS cycle of oversized items. Picked and packed separately
from regular-sized items, the orders containing oversized items are suffering slower fulfillment. Nick wants
to identify potential improvements to the PPS process for oversized items to reduce the PPS cycle time.
So
OBJECTIVES
1. Leverage statistical tests to demonstrate significant differences between sample data sets. The
opportunity also exists for students to demonstrate the dangers of using exhaustive t tests among sample
averages rather than the more demanding ANOVA test paired with posthoc tests (this teaching note
uses either Tukey Honest Significant Difference (HSD) or Tukey-Kramer posthoc tests in the “Q1 –
Productivity” worksheet of the accompanying Microsoft Excel workbook).
2. Demonstrate the value of applying principles of Lean Six Sigma management (or the Toyota Production
System) to reduce process variability. The statistical analysis can contribute to the well-known define,
measure, analyze, improve, and control (DMAIC) cycle as the basis for the analyze stage; or the study stage
of the plan-do-study-act (PDSA) cycle. This teaching note uses the more contemporary DMAIC cycle.
The Case Solution Starts From page 7
, e
pl
m
Sa
ASSIGNMENT QUESTIONS
n
1. Given the data in Exhibit 5 of the case, what are the centre’s performance metrics by shift? The
tio
performance metrics included the following, calculated for each shift: (1) order productivity (per FTE), (2)
line productivity (per FTE), and (3) warehouse productivity (the number of lines fulfilled per shift,
regardless of the number of staff members working during that shift). Are there statistically significant
lu
differences between shifts? If so, which ones? Should exhaustive t tests be used or the ANOVA (analysis
of variance) test?
So
2. Given the data in Exhibit 5, what is (1) the flow rate (or “throughput”) of item fulfillment, (2) the flow
rate of order fulfillment, and (3) the cycle time of order fulfillment (the average time between subsequent
orders being completed by the process) ? What cycle time would be required to eliminate any carry-over
into the subsequent week (from Sunday to Monday)?
3. Of the three PPS stages, which do you expect has the most variable cycle time for oversized items?
Considering only the stage that have you have identified, what do you recommend Nick should do to reduce
the cycle time? What impact would Nick’s action have on the centre’s performance metrics?
The Case Solution Starts From page 7
, e
pl
m
Sa
n
2. Given the data in Exhibit 5 of the case, what is (1) the flow rate of item fulfillment, (2) the flow
tio
rate of order fulfillment, and (3) the cycle time of order fulfillment? What cycle time is going to
be required to eliminate any carry-over into the subsequent week (from Sunday until Monday)?
lu
Taking into consideration only the staff involved in the PPS process, and calculating the sum of all lines
fulfilled in the first week and then dividing by the sum of all FTE shifts in that week yields a flow rate of
236 items per FTE shift. Repeating this calculation for Week 2 generates approximately 224 items per FTE
So
shift.
Regarding order fulfillment, the warehouse PPS staff have fulfilled approximately 98 orders per FTE shift
in Week 1 and 129 orders per FTE shift in Week 2.
Taking the Week 1 order productivity of 98 orders per FTE shift and dividing it by 7 hours (the shift length)
yields an hourly productivity of approximately 13 orders per hour, or a cycle time of about 4.6 minutes.
The total number of orders in Week 1 is 14,817 (including the 432 orders that have carried over from the
previous week). Week 1 includes a total of 147 FTE shifts. This result implies that a flow rate of 100.8 orders
per FTE shift is required to meet the demand rate if carry-overs are not permitted. Assuming a shift length of
seven hours of work, the corresponding hourly flow rate is approximately 14.4 orders per hour, corresponding
The Case Solution Starts From page 7
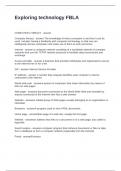
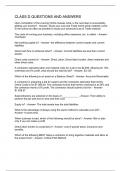
, EXHIBIT -1: ORDER PRODUCTIVITY BY SHIFT
Order productivity
Day Date Shift
Mon. 01/03/22 Day 116
Mon. 01/03/22 Night 137
Tues. 01/04/22 Day 92
Tues. 01/04/22 Night 104
Weds. 01/05/22 Day 82
Weds. 01/05/22 Night 125
Thurs. 01/06/22 Day 108
Thurs. 01/06/22 Night 115
Fri. 01/07/22 Day 64
Fri. 01/07/22 Night 110
Sat. 01/08/22 Weekend 88
Sun.
e
pl
m
Sa
n
tio
lu
So
The Case Solution Starts From page 7
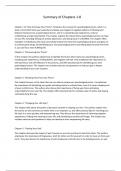
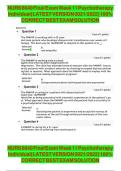
, EXHIBIT -2: PAIRED T TESTS OF ORDER PRODUCTIVITY BY SHIFT
Table 1
Day Night
Mean 91.01271 117.7955
Variance 249.2624 238.866
Observations 10 10
Hypothesized mean difference 0
df 18
t stat –3.83344
P (T <= t) one tail 0.000609
t critical one tail 1.734064
P (T <= t) two tail 0.001217
t critical two tail 2.100922
e
Table 2
pl
Day Weekend
m
Sa
n
tio
lu
So
The Case Solution Starts From page 7
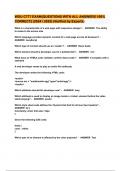
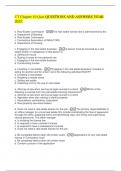
, EXHIBIT -9: PAIRED T TESTS FOR WAREHOUSE PRODUCTIVITY BY SHIFT
Table 1
Day Night
Mean 144.4107578 230.7034127
Variance 447.2574482 1237.558824
Observations 10 10
Hypothesized mean difference 0
df 15
t stat –6.648100199
P (T <= t) one tail 3.8832E-06
t critical one tail 1.753050356
P (T <= t) two tail 7.7664E-06
t critical two tail 2.131449546
e
pl
Table 2
m
Day Weekend
Sa
n
tio
lu
So
The Case Solution Starts From page 7
CASE STUDY SOLUTION
e
pl
SYNOPSIS
m
Sa
Nick works as the weekend shift supervisor at Lee Valley’s fulfillment centre in Ottawa. The company
operates three shifts—a day and night shift on weekdays and a weekend (day) shift on Saturday and Sunday.
Reviewing performance statistics, he has noted that the night-shift staff in the warehouse is achieving higher
performance in order fulfillment and line-item fulfillment. The performance of the weekend-shift staff is
n
more aligned with that of the day-shift staff, which has to deal with deliveries of incoming items and placing
tio
the items in the warehouse. Nick wonders why the weekend shift seems to lag behind and whether these
differences are significant and meaningful.
lu
Nick finds that there appears to be a lag in the PPS cycle of oversized items. Picked and packed separately
from regular-sized items, the orders containing oversized items are suffering slower fulfillment. Nick wants
to identify potential improvements to the PPS process for oversized items to reduce the PPS cycle time.
So
OBJECTIVES
1. Leverage statistical tests to demonstrate significant differences between sample data sets. The
opportunity also exists for students to demonstrate the dangers of using exhaustive t tests among sample
averages rather than the more demanding ANOVA test paired with posthoc tests (this teaching note
uses either Tukey Honest Significant Difference (HSD) or Tukey-Kramer posthoc tests in the “Q1 –
Productivity” worksheet of the accompanying Microsoft Excel workbook).
2. Demonstrate the value of applying principles of Lean Six Sigma management (or the Toyota Production
System) to reduce process variability. The statistical analysis can contribute to the well-known define,
measure, analyze, improve, and control (DMAIC) cycle as the basis for the analyze stage; or the study stage
of the plan-do-study-act (PDSA) cycle. This teaching note uses the more contemporary DMAIC cycle.
The Case Solution Starts From page 7
, e
pl
m
Sa
ASSIGNMENT QUESTIONS
n
1. Given the data in Exhibit 5 of the case, what are the centre’s performance metrics by shift? The
tio
performance metrics included the following, calculated for each shift: (1) order productivity (per FTE), (2)
line productivity (per FTE), and (3) warehouse productivity (the number of lines fulfilled per shift,
regardless of the number of staff members working during that shift). Are there statistically significant
lu
differences between shifts? If so, which ones? Should exhaustive t tests be used or the ANOVA (analysis
of variance) test?
So
2. Given the data in Exhibit 5, what is (1) the flow rate (or “throughput”) of item fulfillment, (2) the flow
rate of order fulfillment, and (3) the cycle time of order fulfillment (the average time between subsequent
orders being completed by the process) ? What cycle time would be required to eliminate any carry-over
into the subsequent week (from Sunday to Monday)?
3. Of the three PPS stages, which do you expect has the most variable cycle time for oversized items?
Considering only the stage that have you have identified, what do you recommend Nick should do to reduce
the cycle time? What impact would Nick’s action have on the centre’s performance metrics?
The Case Solution Starts From page 7
, e
pl
m
Sa
n
2. Given the data in Exhibit 5 of the case, what is (1) the flow rate of item fulfillment, (2) the flow
tio
rate of order fulfillment, and (3) the cycle time of order fulfillment? What cycle time is going to
be required to eliminate any carry-over into the subsequent week (from Sunday until Monday)?
lu
Taking into consideration only the staff involved in the PPS process, and calculating the sum of all lines
fulfilled in the first week and then dividing by the sum of all FTE shifts in that week yields a flow rate of
236 items per FTE shift. Repeating this calculation for Week 2 generates approximately 224 items per FTE
So
shift.
Regarding order fulfillment, the warehouse PPS staff have fulfilled approximately 98 orders per FTE shift
in Week 1 and 129 orders per FTE shift in Week 2.
Taking the Week 1 order productivity of 98 orders per FTE shift and dividing it by 7 hours (the shift length)
yields an hourly productivity of approximately 13 orders per hour, or a cycle time of about 4.6 minutes.
The total number of orders in Week 1 is 14,817 (including the 432 orders that have carried over from the
previous week). Week 1 includes a total of 147 FTE shifts. This result implies that a flow rate of 100.8 orders
per FTE shift is required to meet the demand rate if carry-overs are not permitted. Assuming a shift length of
seven hours of work, the corresponding hourly flow rate is approximately 14.4 orders per hour, corresponding
The Case Solution Starts From page 7
, EXHIBIT -1: ORDER PRODUCTIVITY BY SHIFT
Order productivity
Day Date Shift
Mon. 01/03/22 Day 116
Mon. 01/03/22 Night 137
Tues. 01/04/22 Day 92
Tues. 01/04/22 Night 104
Weds. 01/05/22 Day 82
Weds. 01/05/22 Night 125
Thurs. 01/06/22 Day 108
Thurs. 01/06/22 Night 115
Fri. 01/07/22 Day 64
Fri. 01/07/22 Night 110
Sat. 01/08/22 Weekend 88
Sun.
e
pl
m
Sa
n
tio
lu
So
The Case Solution Starts From page 7
, EXHIBIT -2: PAIRED T TESTS OF ORDER PRODUCTIVITY BY SHIFT
Table 1
Day Night
Mean 91.01271 117.7955
Variance 249.2624 238.866
Observations 10 10
Hypothesized mean difference 0
df 18
t stat –3.83344
P (T <= t) one tail 0.000609
t critical one tail 1.734064
P (T <= t) two tail 0.001217
t critical two tail 2.100922
e
Table 2
pl
Day Weekend
m
Sa
n
tio
lu
So
The Case Solution Starts From page 7
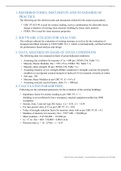
, EXHIBIT -9: PAIRED T TESTS FOR WAREHOUSE PRODUCTIVITY BY SHIFT
Table 1
Day Night
Mean 144.4107578 230.7034127
Variance 447.2574482 1237.558824
Observations 10 10
Hypothesized mean difference 0
df 15
t stat –6.648100199
P (T <= t) one tail 3.8832E-06
t critical one tail 1.753050356
P (T <= t) two tail 7.7664E-06
t critical two tail 2.131449546
e
pl
Table 2
m
Day Weekend
Sa
n
tio
lu
So
The Case Solution Starts From page 7