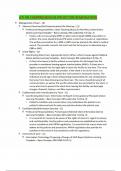
Summary statistics | Step by Step
Which test to choose?
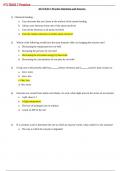
1. Independent samples t-test
•Dependent variable is continuous (interval or ratio).
•One independent variable (categorical).
•Compares the mean of two different subgroups (men and women).
Hypotheses
•Can men with a beard gather more phone numbers of girls in a bar than men without a beard?
•Women spend more time on their phone than men.
•Young people have more followers on Instagram than old people.
•Dogs eat more sausages than cats.
•It is easier to answer questions without negations than questions with negations.
2. Dependent (paired) samples t-test
•Dependent variable is continuous (time in most cases).
•One independent variable (categorical).
•Same group of people.
•Compare difference in score before and after manipulation (at two times).
•Same situation measured at two different times.
Hypotheses
•Does watching a ‘slow’ movie make people slower?
•Trustworthiness before seeing video and trustworthiness after seeing video.
•Your grades on the first take home exam are higher than your grades for the second take home exam.
•Teenagers get distracted more by phone ‘buzzing’ than by ‘sound notifications’.
•Roosters near my house make more noise on Sundays than on Mondays.
•People feel happier after seeing a cartoon than they did before that cartoon.
3. One-sample t-test
•Dependent variable is continuous.
•Compares the mean of a group against a fixed value.
•Fixed value is given.
Hypotheses
•Are this years’ premasters smarter than last years’ premasters based on their stats grade (last year 6.4)?
•Students’ evaluations (scale 1-5) of their statistics teachers are positive (i.e. nog neutral, 3).
•A border collie can run up to 48.3 km/h. Chihuahua’s don’t go that fast.
•People are above chance (50%) when being asked to identify the brand was showed during a television
show.
4. Chi-square
•Two categorial variables (two options)
•Relationship
Hypotheses
•Is there a relationship between having a partner and having a depression (versus not having one)?
•What is the relationship between wearing make-up or not and having a romantic partner or not?
, 5. One-way ANOVA
•Often 3 categories (blondes, brunettes and redheads).
•One dependent variable and one independent variable.
Hypotheses
•Do blondes have more fun (mean score of 7 Likert scale items) than brunettes and redheads?
•Do stats teachers have better humor (mean score of 7 Likert scale items) than language and gym teachers?
•Children aged 4 show more facial cues of deception than children aged 6 or 8 (planned contrasts).
•There is a difference between Dutch, Pakistani and Chinese children in how strongly they express happiness
after winning a game (post hoc).
6. Factorial ANOVA
•Dependent variable is continuous.
•Two independent variables (predictors).
•Often three hypotheses stated.
•2 independent variables and 1 dependent variable
Hypotheses
•Does taking drugs (yes/no) and drinking alcohol (yes/no) make people dance longer?
•How do having kids and/or having pets affect the degree of hygiene in people’s household?
•Gestures of people with brain damage are less comprehensible than those of healthy participants.
•Dutch children jump around more after winning a game than Chinese children.
7. Correlation
•Predictor (IV) is continuous.
•Presence or strength of a relationship (does… relate to…).
•Never a relationship between nominal variables.
•Two continuous variables.
Hypotheses
•Does the number of fruits people eat during 6 months relate to their weight loss (in grams)?
•Does the number of partners relate to the number of psychiatric illnesses people have in life?
•Is there a relationship between city size and fun seeking?
8. Regression
•Predictor (IV) is continuous.
•Predictive relationship (does… predict…).
Hypotheses
•Does the amount of money in peoples bank account credit the number of products they buy?
•Does the hours spent studying predict students’ grades?
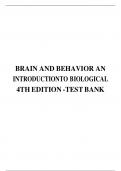
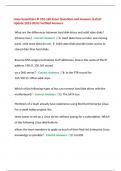
, Which test to choose?
How many What type of How many What type of How many Within (same Test
dependent dependent independent independent categories has situation) or
variables? variable? variables? variable? the between
(outcome) (predictors) independent subjects?
variable?
1 Continuous 1 Categorical 2 Between Independent
t-test
1 Continuous 1 Categorical 2 Within Dependent
t-test
1 Continuous 0 One sample
t-test
1 Categorical 1 Categorical 2 Between Chi-square
1 Continuous 1 Continuous Correlation
1 Continuous 1 Categorical >2 Between One-way
ANOVA
1 Continuous >1 Categorical 2 or > 2 Between Two-way
ANOVA
1 Continuous 1 Continuous Regression
Measurement levels
Gender (men/women) Nominal
Time on phone Ratio
Number of followers Ratio
Age (young/old) Nominal
Evaluation of teacher (scale) Interval
Time on watching TV Ratio
Happiness (scale) Interval
, Get your data ready
1. Check whether the dataset contains invalid input or scores
•Items that have been measured on a 7-point Likert-scale cannot contain scores of 8 of higher.
•Does 1 mean negative and 7 mean positive in every question?
2. Recode variables
Check whether items for scales need recoding (reverse scores). Items for scales should all measure a positive
attitude or all measure a negative attitude.
1. Transform
2. Recode into different variables
3. Put items that needs recoding into the empty box on the right
4. Give output variable a new name (NameOriginalVariable_R)
5. Click on ‘change’
6. Click on ‘old and new values’
7. Enter the appropriate old and new values (1 becomes 7).
8. For multiple questions at once, you just select them all in the box and then check in the output.
3. Check for reliability
1. Analyze
2. Scale
3. Reliability analysis
4. Put the items belonging to the same scale into the empty box
(select the new recoded variables!)
5. Give the analysis a proper scale label
6. Click on ‘statistics’ on the top right
7. Check in ‘descriptives for’: include all 3 (item, scale, scale if item deleted)
8. Click within ‘inter-item’ the correlations option
9. Continue
10. Click OK and read the table
Report
To test whether women are more depressed than men, an
independent samples t-test was performed with gender (men or
women) as independent variable and their score on BDI (Beck
Depression Inventory) scale as dependent variable.
Participants’ depression was measured with 21 items (e.g. How
often have you felt that you were unable to control the important
things in your life?) on a 4 point scale (1= I do not feel sad to
4= I am so sad or unhappy that I can’t stand it). The scale had a
good reliability, Cronbach’s α = .94.
Which test to choose?
1. Independent samples t-test
•Dependent variable is continuous (interval or ratio).
•One independent variable (categorical).
•Compares the mean of two different subgroups (men and women).
Hypotheses
•Can men with a beard gather more phone numbers of girls in a bar than men without a beard?
•Women spend more time on their phone than men.
•Young people have more followers on Instagram than old people.
•Dogs eat more sausages than cats.
•It is easier to answer questions without negations than questions with negations.
2. Dependent (paired) samples t-test
•Dependent variable is continuous (time in most cases).
•One independent variable (categorical).
•Same group of people.
•Compare difference in score before and after manipulation (at two times).
•Same situation measured at two different times.
Hypotheses
•Does watching a ‘slow’ movie make people slower?
•Trustworthiness before seeing video and trustworthiness after seeing video.
•Your grades on the first take home exam are higher than your grades for the second take home exam.
•Teenagers get distracted more by phone ‘buzzing’ than by ‘sound notifications’.
•Roosters near my house make more noise on Sundays than on Mondays.
•People feel happier after seeing a cartoon than they did before that cartoon.
3. One-sample t-test
•Dependent variable is continuous.
•Compares the mean of a group against a fixed value.
•Fixed value is given.
Hypotheses
•Are this years’ premasters smarter than last years’ premasters based on their stats grade (last year 6.4)?
•Students’ evaluations (scale 1-5) of their statistics teachers are positive (i.e. nog neutral, 3).
•A border collie can run up to 48.3 km/h. Chihuahua’s don’t go that fast.
•People are above chance (50%) when being asked to identify the brand was showed during a television
show.
4. Chi-square
•Two categorial variables (two options)
•Relationship
Hypotheses
•Is there a relationship between having a partner and having a depression (versus not having one)?
•What is the relationship between wearing make-up or not and having a romantic partner or not?
, 5. One-way ANOVA
•Often 3 categories (blondes, brunettes and redheads).
•One dependent variable and one independent variable.
Hypotheses
•Do blondes have more fun (mean score of 7 Likert scale items) than brunettes and redheads?
•Do stats teachers have better humor (mean score of 7 Likert scale items) than language and gym teachers?
•Children aged 4 show more facial cues of deception than children aged 6 or 8 (planned contrasts).
•There is a difference between Dutch, Pakistani and Chinese children in how strongly they express happiness
after winning a game (post hoc).
6. Factorial ANOVA
•Dependent variable is continuous.
•Two independent variables (predictors).
•Often three hypotheses stated.
•2 independent variables and 1 dependent variable
Hypotheses
•Does taking drugs (yes/no) and drinking alcohol (yes/no) make people dance longer?
•How do having kids and/or having pets affect the degree of hygiene in people’s household?
•Gestures of people with brain damage are less comprehensible than those of healthy participants.
•Dutch children jump around more after winning a game than Chinese children.
7. Correlation
•Predictor (IV) is continuous.
•Presence or strength of a relationship (does… relate to…).
•Never a relationship between nominal variables.
•Two continuous variables.
Hypotheses
•Does the number of fruits people eat during 6 months relate to their weight loss (in grams)?
•Does the number of partners relate to the number of psychiatric illnesses people have in life?
•Is there a relationship between city size and fun seeking?
8. Regression
•Predictor (IV) is continuous.
•Predictive relationship (does… predict…).
Hypotheses
•Does the amount of money in peoples bank account credit the number of products they buy?
•Does the hours spent studying predict students’ grades?
, Which test to choose?
How many What type of How many What type of How many Within (same Test
dependent dependent independent independent categories has situation) or
variables? variable? variables? variable? the between
(outcome) (predictors) independent subjects?
variable?
1 Continuous 1 Categorical 2 Between Independent
t-test
1 Continuous 1 Categorical 2 Within Dependent
t-test
1 Continuous 0 One sample
t-test
1 Categorical 1 Categorical 2 Between Chi-square
1 Continuous 1 Continuous Correlation
1 Continuous 1 Categorical >2 Between One-way
ANOVA
1 Continuous >1 Categorical 2 or > 2 Between Two-way
ANOVA
1 Continuous 1 Continuous Regression
Measurement levels
Gender (men/women) Nominal
Time on phone Ratio
Number of followers Ratio
Age (young/old) Nominal
Evaluation of teacher (scale) Interval
Time on watching TV Ratio
Happiness (scale) Interval
, Get your data ready
1. Check whether the dataset contains invalid input or scores
•Items that have been measured on a 7-point Likert-scale cannot contain scores of 8 of higher.
•Does 1 mean negative and 7 mean positive in every question?
2. Recode variables
Check whether items for scales need recoding (reverse scores). Items for scales should all measure a positive
attitude or all measure a negative attitude.
1. Transform
2. Recode into different variables
3. Put items that needs recoding into the empty box on the right
4. Give output variable a new name (NameOriginalVariable_R)
5. Click on ‘change’
6. Click on ‘old and new values’
7. Enter the appropriate old and new values (1 becomes 7).
8. For multiple questions at once, you just select them all in the box and then check in the output.
3. Check for reliability
1. Analyze
2. Scale
3. Reliability analysis
4. Put the items belonging to the same scale into the empty box
(select the new recoded variables!)
5. Give the analysis a proper scale label
6. Click on ‘statistics’ on the top right
7. Check in ‘descriptives for’: include all 3 (item, scale, scale if item deleted)
8. Click within ‘inter-item’ the correlations option
9. Continue
10. Click OK and read the table
Report
To test whether women are more depressed than men, an
independent samples t-test was performed with gender (men or
women) as independent variable and their score on BDI (Beck
Depression Inventory) scale as dependent variable.
Participants’ depression was measured with 21 items (e.g. How
often have you felt that you were unable to control the important
things in your life?) on a 4 point scale (1= I do not feel sad to
4= I am so sad or unhappy that I can’t stand it). The scale had a
good reliability, Cronbach’s α = .94.