SPSS Samenvatting
Jaar 2; 2023 - 2024
1
,Inhoudsopgave
1. Significantietoetsing; Verschilonderzoeksvragen ................................................................... 3
1.1 Testen................................................................................................................. 3
1.2 Chi-kwadraattoets.................................................................................................. 3
1.2.1 Voorwaarden ............................................................................................... 3
1.2.2 Uitvoering.................................................................................................... 3
1.2.3 Analyze ....................................................................................................... 4
1.3 Mann-Whitney U-toets .............................................................................................. 5
1.3.1 Uitvoering.................................................................................................... 5
1.3.2 Analyze ....................................................................................................... 5
1.4 Kruskal-Wallistoets ................................................................................................. 6
1.4.1 Uitvoering.................................................................................................... 6
1.4.2 Analyze ....................................................................................................... 6
1.5 T-toets................................................................................................................. 7
1.5.1 Voorwaarden ............................................................................................... 7
1.5.2 Uitvoering.................................................................................................... 7
1.5.3 Analyze ....................................................................................................... 8
1.6 Cohen’s d ............................................................................................................. 9
1.6.1 Formule ...................................................................................................... 9
1.6.2 De correlatiecoëfficiënt (r) ................................................................................ 9
1.6.3 Determinatiecoëfficiënt (r2) ............................................................................. 10
1.6.4 Verklaarde variantie...................................................................................... 10
1.6.5 Scores en interpretatie van de correlatie- en determinatiecoëfficiënt ............................ 10
1.6.6 Voorbeeld van de Cohen’s d berekening.............................................................. 11
2. Significantietoetsing; Samenhangonderzoeksvragen ............................................................ 12
2.1 Testen............................................................................................................... 12
2.2 Cramer’s V.......................................................................................................... 12
2.2.1 Voorwaarden ............................................................................................. 12
2.2.2 Uitvoering.................................................................................................. 12
2.2.3 Analyze ..................................................................................................... 13
2.2.4 Scores en interpretaties van Cramer’s V............................................................... 13
2.3 Spearman’s Rangcorrelatie ..................................................................................... 14
2.3.1 Uitvoering: ................................................................................................. 14
2.3.2 Analyze ..................................................................................................... 14
2.3.3 Scores en interpretaties van Spearman ................................................................ 15
2.4 Pearson’s Productmomentcorrelatie......................................................................... 15
2.4.1 Voorwaarden ............................................................................................. 15
2.4.2 Uitvoering.................................................................................................. 15
2.4.3 Analyze ..................................................................................................... 15
2.4.4 Scores en interpretaties van Pearson .................................................................. 16
2
, 1. Significantietoetsing; Verschilonderzoeksvragen
1.1 Testen
1. Chi-kwadraattoets
2. Mann-Whitney U toets
3. Krustal-Wallistoets
4. T-toets + Cohen’s d
❖ Splitsingsvariabele: De variabele waarin het verschil wordt gemeten.
❖ Testvariabele: De variabele waarmee de splitsingsvariabele wordt gemeten.
1.2 Chi-kwadraattoets
De chi-kwadraattoets gebruik je bij een verschilvraag met variabele die op nominaal gemeten zijn,
of er moet sprake zijn van ordinale discrete gegevens.
1.2.1 Voorwaarden
❖ Er mag geen enkele verwachte celfrequentie kleiner zijn dan 0.1.
❖ Er moet minimaal 80% van de verwachte celfrequenties een waarde hebben die groter
is dan 5.
1.2.2 Uitvoering
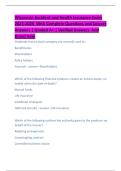
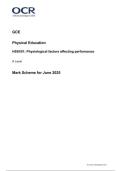
1. [Analyze] -> [Descriptive Statistics] -> [Crosstabs…]
2. Plaats de splitsingsvariabele
onder ‘Column(s):’.
<<
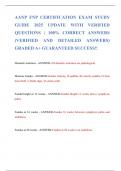
3. Plaats de testvariabele
onder ‘Row(s):’.
<<
3
Jaar 2; 2023 - 2024
1
,Inhoudsopgave
1. Significantietoetsing; Verschilonderzoeksvragen ................................................................... 3
1.1 Testen................................................................................................................. 3
1.2 Chi-kwadraattoets.................................................................................................. 3
1.2.1 Voorwaarden ............................................................................................... 3
1.2.2 Uitvoering.................................................................................................... 3
1.2.3 Analyze ....................................................................................................... 4
1.3 Mann-Whitney U-toets .............................................................................................. 5
1.3.1 Uitvoering.................................................................................................... 5
1.3.2 Analyze ....................................................................................................... 5
1.4 Kruskal-Wallistoets ................................................................................................. 6
1.4.1 Uitvoering.................................................................................................... 6
1.4.2 Analyze ....................................................................................................... 6
1.5 T-toets................................................................................................................. 7
1.5.1 Voorwaarden ............................................................................................... 7
1.5.2 Uitvoering.................................................................................................... 7
1.5.3 Analyze ....................................................................................................... 8
1.6 Cohen’s d ............................................................................................................. 9
1.6.1 Formule ...................................................................................................... 9
1.6.2 De correlatiecoëfficiënt (r) ................................................................................ 9
1.6.3 Determinatiecoëfficiënt (r2) ............................................................................. 10
1.6.4 Verklaarde variantie...................................................................................... 10
1.6.5 Scores en interpretatie van de correlatie- en determinatiecoëfficiënt ............................ 10
1.6.6 Voorbeeld van de Cohen’s d berekening.............................................................. 11
2. Significantietoetsing; Samenhangonderzoeksvragen ............................................................ 12
2.1 Testen............................................................................................................... 12
2.2 Cramer’s V.......................................................................................................... 12
2.2.1 Voorwaarden ............................................................................................. 12
2.2.2 Uitvoering.................................................................................................. 12
2.2.3 Analyze ..................................................................................................... 13
2.2.4 Scores en interpretaties van Cramer’s V............................................................... 13
2.3 Spearman’s Rangcorrelatie ..................................................................................... 14
2.3.1 Uitvoering: ................................................................................................. 14
2.3.2 Analyze ..................................................................................................... 14
2.3.3 Scores en interpretaties van Spearman ................................................................ 15
2.4 Pearson’s Productmomentcorrelatie......................................................................... 15
2.4.1 Voorwaarden ............................................................................................. 15
2.4.2 Uitvoering.................................................................................................. 15
2.4.3 Analyze ..................................................................................................... 15
2.4.4 Scores en interpretaties van Pearson .................................................................. 16
2
, 1. Significantietoetsing; Verschilonderzoeksvragen
1.1 Testen
1. Chi-kwadraattoets
2. Mann-Whitney U toets
3. Krustal-Wallistoets
4. T-toets + Cohen’s d
❖ Splitsingsvariabele: De variabele waarin het verschil wordt gemeten.
❖ Testvariabele: De variabele waarmee de splitsingsvariabele wordt gemeten.
1.2 Chi-kwadraattoets
De chi-kwadraattoets gebruik je bij een verschilvraag met variabele die op nominaal gemeten zijn,
of er moet sprake zijn van ordinale discrete gegevens.
1.2.1 Voorwaarden
❖ Er mag geen enkele verwachte celfrequentie kleiner zijn dan 0.1.
❖ Er moet minimaal 80% van de verwachte celfrequenties een waarde hebben die groter
is dan 5.
1.2.2 Uitvoering
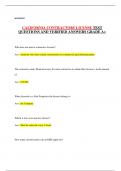
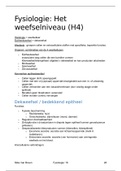
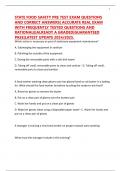
1. [Analyze] -> [Descriptive Statistics] -> [Crosstabs…]
2. Plaats de splitsingsvariabele
onder ‘Column(s):’.
<<
3. Plaats de testvariabele
onder ‘Row(s):’.
<<
3