WEEK 4
. Introduction
Statistical hypothesis testing - two opposing hypotheses are stated and
using data we can find the truthfulness of the two hypotheses, so a justified
conclusion can be drawn
One sample t-test -> only one variable used and we consider hypotheses
about the population mean of one random variable
2 Example question
. The procedure of the two-sided t test
Step 1: hypotheses and significance level
● Set up two opposing hypotheses: the null-hypothesis H0 and alternative
hypothesis H1
○ H0: µ = 12 (the mean weight of the tablets is right) and H1: µ ≠ 12
● H0 = the test value -> the preliminary working hypothesis = value
assumed during the testing procedure
● H1 = research hypothesis
● H1 can take 3 forms:
1 ○ Two sided (≠)
, ○ Left sided (<)
○ Right sided (>)
● Important to formulate the hypotheses before looking at the data +
choose a significance level (α)
Step 2: test statistic and its distribution
● Using the t formula - since we don’t know the distribution of the
population because µ and σ are unknown
● To make a choice between the two hypotheses we use the t distribution
Step 3: conditions for validity for the test
. The sample is taken random
. The test variable x is approximately normally distributed or the sample
size n is large (N≥30)
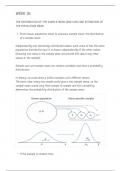
Step 4: rejection region
● Set up a decision rule: specify rejection region -> a set of possible
outcomes of the test statistic for which H0 will be rejected in favour of
H1
● The rejection region contains the values of the t-statistic that provide
support for H1
●
● These are the critical values
Step 5: outcome and statistical decision
● The actual data is used to calculate the outcome of X- and s -> and
substituted into the t formal
Step 6: conclusion
. The two-tailed p-value
Measures how strong the support for H1 is by the data
P-value = the tail probability of the calculated t value (in SPSS: Sig. two
tailed)
. Introduction
Statistical hypothesis testing - two opposing hypotheses are stated and
using data we can find the truthfulness of the two hypotheses, so a justified
conclusion can be drawn
One sample t-test -> only one variable used and we consider hypotheses
about the population mean of one random variable
2 Example question
. The procedure of the two-sided t test
Step 1: hypotheses and significance level
● Set up two opposing hypotheses: the null-hypothesis H0 and alternative
hypothesis H1
○ H0: µ = 12 (the mean weight of the tablets is right) and H1: µ ≠ 12
● H0 = the test value -> the preliminary working hypothesis = value
assumed during the testing procedure
● H1 = research hypothesis
● H1 can take 3 forms:
1 ○ Two sided (≠)
, ○ Left sided (<)
○ Right sided (>)
● Important to formulate the hypotheses before looking at the data +
choose a significance level (α)
Step 2: test statistic and its distribution
● Using the t formula - since we don’t know the distribution of the
population because µ and σ are unknown
● To make a choice between the two hypotheses we use the t distribution
Step 3: conditions for validity for the test
. The sample is taken random
. The test variable x is approximately normally distributed or the sample
size n is large (N≥30)
Step 4: rejection region
● Set up a decision rule: specify rejection region -> a set of possible
outcomes of the test statistic for which H0 will be rejected in favour of
H1
● The rejection region contains the values of the t-statistic that provide
support for H1
●
● These are the critical values
Step 5: outcome and statistical decision
● The actual data is used to calculate the outcome of X- and s -> and
substituted into the t formal
Step 6: conclusion
. The two-tailed p-value
Measures how strong the support for H1 is by the data
P-value = the tail probability of the calculated t value (in SPSS: Sig. two
tailed)