SOLUTIONS MANUAL
, TABLE OF CONTENTS
Solutions to Problems in Chapter 2 pp. 1-18
Solutions to Problems in Chapter 3 pp. 19-28
Solutions to Problems in Chapter 4 pp. 29-48
Solutions to Problems in Chapter 5 pp. 49-75
Solutions to Problems in Chapter 6 pp. 76-78
Solutions to Problems in Chapter 8 pp. 79-99
Solutions to Problems in Chapter 9 pp. 100-107
@Seismicisolation
@Seismicisolation
iii
, SOLUTIONS TO PROBLEMS IN CHAPTER 2
Problem 2.1. The results of tests to determine the modulus of rupture (MOR) for a set of
timber beams are shown in Table P2.1.
A. Plot the relative frequency and cumulative frequency histograms.
B. Calculate the sample mean, standard deviation, and coefficient of variation.
C. Plot the data on normal probability paper.
Solution:
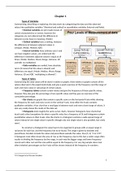
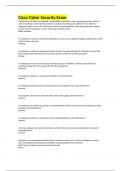
A. For the histogram plots, the interval size is chosen to be 250. There are 45 data points.
Interval Relative Cumulative
Frequency Frequency
3250-3500 0 0
3500-3750 0.06667 0.066667
3750-4000 0.11111 0.177778
4000-4250 0.02222 0.200000
4250-4500 0.06667 0.266667
4500-4750 0.11111 0.377778
4750-5000 0.08889 0.466667
5000-5250 0.15556 0.622222
5250-5500 0.11111 0.733333
5500-5750 0.04444 0.777778
5750-6000 0.11111 0.888889
6000-6250 0.02222 0.911111
6250-6500 0.04444 0.955556
6500-6750 0 0.955556
6750-7000 0 0.955556
7000-7250 0.04444 1
7250-7500 0 1
Relative Frequency
0.18
0.16
0.14
0.12
0.1
0.08
0.06
0.04
0.02
0
3250-3500
3750-4000
4250-4500
4750-5000
5250-5500
5750-6000
6250-6500
6750-7000
7250-7500
@Seismicisolation
@Seismicisolation
iv
, Cumulative Frequency
1.2
1
0.8
0.6
0.4
0.2
0
3250-3500
3750-4000
4250-4500
4750-5000
5250-5500
5750-6000
6250-6500
6750-7000
7250-7500
B. Using Eqns. 2.25 and 2.26, sample mean = x = 5031 and sample standard deviation = sX =
880.4. The coefficient of variation based on sample parameters is s X / x = 0.175.
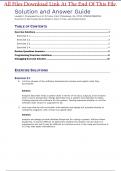
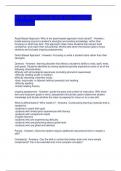
C. The step-by-step procedure described in Section 2.5 is followed to construct the plot on
normal probability paper.
MOR data on normal probability paper
3
Standard Normal Variate
2
1
0
-1
-2
-3
0 2000 4000 6000 8000
MOR
-------------------------------------------
Problem 2.2. A set of test data for the load-carrying capacity of a member is shown in Table
P2.2.
A. Plot the test data on normal probability paper.
B. Plot a normal distribution on the same probability paper. Use the sample mean and
standard deviation as estimates of the true mean and standard deviation.
C. Plot a lognormal distribution on the same normal probability paper. Use the sample mean
and standard deviation as estimates of the true mean and standard deviation.
@Seismicisolation
@Seismicisolation
v
, TABLE OF CONTENTS
Solutions to Problems in Chapter 2 pp. 1-18
Solutions to Problems in Chapter 3 pp. 19-28
Solutions to Problems in Chapter 4 pp. 29-48
Solutions to Problems in Chapter 5 pp. 49-75
Solutions to Problems in Chapter 6 pp. 76-78
Solutions to Problems in Chapter 8 pp. 79-99
Solutions to Problems in Chapter 9 pp. 100-107
@Seismicisolation
@Seismicisolation
iii
, SOLUTIONS TO PROBLEMS IN CHAPTER 2
Problem 2.1. The results of tests to determine the modulus of rupture (MOR) for a set of
timber beams are shown in Table P2.1.
A. Plot the relative frequency and cumulative frequency histograms.
B. Calculate the sample mean, standard deviation, and coefficient of variation.
C. Plot the data on normal probability paper.
Solution:
A. For the histogram plots, the interval size is chosen to be 250. There are 45 data points.
Interval Relative Cumulative
Frequency Frequency
3250-3500 0 0
3500-3750 0.06667 0.066667
3750-4000 0.11111 0.177778
4000-4250 0.02222 0.200000
4250-4500 0.06667 0.266667
4500-4750 0.11111 0.377778
4750-5000 0.08889 0.466667
5000-5250 0.15556 0.622222
5250-5500 0.11111 0.733333
5500-5750 0.04444 0.777778
5750-6000 0.11111 0.888889
6000-6250 0.02222 0.911111
6250-6500 0.04444 0.955556
6500-6750 0 0.955556
6750-7000 0 0.955556
7000-7250 0.04444 1
7250-7500 0 1
Relative Frequency
0.18
0.16
0.14
0.12
0.1
0.08
0.06
0.04
0.02
0
3250-3500
3750-4000
4250-4500
4750-5000
5250-5500
5750-6000
6250-6500
6750-7000
7250-7500
@Seismicisolation
@Seismicisolation
iv
, Cumulative Frequency
1.2
1
0.8
0.6
0.4
0.2
0
3250-3500
3750-4000
4250-4500
4750-5000
5250-5500
5750-6000
6250-6500
6750-7000
7250-7500
B. Using Eqns. 2.25 and 2.26, sample mean = x = 5031 and sample standard deviation = sX =
880.4. The coefficient of variation based on sample parameters is s X / x = 0.175.
C. The step-by-step procedure described in Section 2.5 is followed to construct the plot on
normal probability paper.
MOR data on normal probability paper
3
Standard Normal Variate
2
1
0
-1
-2
-3
0 2000 4000 6000 8000
MOR
-------------------------------------------
Problem 2.2. A set of test data for the load-carrying capacity of a member is shown in Table
P2.2.
A. Plot the test data on normal probability paper.
B. Plot a normal distribution on the same probability paper. Use the sample mean and
standard deviation as estimates of the true mean and standard deviation.
C. Plot a lognormal distribution on the same normal probability paper. Use the sample mean
and standard deviation as estimates of the true mean and standard deviation.
@Seismicisolation
@Seismicisolation
v