STATISTICS SUMMARY
Course objectives
To do well on the final examination, you should be able to do the following:
1. You can correctly describe in your own words the statistical jargon in this course.
For instance: p-value, effect size, backward elimination, variance inflation factor,
parsimony, planned comparisons, Bayes factor, likelihood, etc...
2. You can correctly interpret the output and outcome of the following statistical
procedures:
• Two-way ANOVA, including interactions and main effects, planned comparisons
using contrasts and post-hoc test.
• Multiple linear regression and model selection.
• Meta-analysis and forest plots.
• A Bayesian independent samples t-test.
3. You can name and explain in your own words what factors determine the power of
an experimental design and its statistical analysis.
4. You have used the G*Power software to calculate a sample size and perform a
formal power analysis for a 2-sample experimental design, a χ2 test of independence,
a linear regression.
5. You have developed a simple comprehensive search strategy and used the RevMan
software for data extraction and meta-analysis.
6. You have developed a sound critical attitude towards scientific claims in the
popular media.
Statistical analysis→ JASP
Power analysis & sample size calculations→ G*Power
Meta-analyses→ Meta-essentials
CHAPTER 3 – FACTORIAL DESIGNS
= measurements or observations recorded at various levels of two independent
variables or factors
mean response→ one-sided t-test for independent samples
difference bw mean responses→ one-way ANOVA
effect size = mean1 – mean2
Main effects: the separate effects of the factors
Interaction effect: whether the original independent variable depends on the level of
another independent variable
• df = df of two main effects
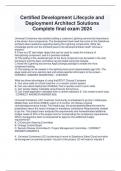
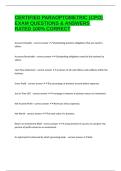
Interaction plot: shows mean or median of dependent variable for each combo of the
independent variables
, Factorial design & general linear model
Two-way ANOVA
Analyzes the variance within & between groups, classified by two independent
variables or factors. Most important feature: enables us to assess the interaction
(synergism, interference) between variables in the general linear model.
- does not say where exactly the difference is though
General Linear Model
A model of the form:
ylmn = µ + αl + βm + γlm + elmn
where:
y: response/result (e.g weight loss)
l: one independent variable
m: other independent variable
n: subject number (3rd person→ n = 3)
μ: constant representing overall mean of all observation
αl & βm: constants reflecting effects of the 2 independent variables
elm: error term including unexplained variance or variance within group← normally
distributed w mean 0
A two-way ANOVA analyzes data containing:
a. one independent variable with two levels
b. one dependent variable with two levels
c. two or more independent variables
d. two or more dependent variables
What are the factors in a two way ANOVA?
a. interactions between variables
b. dependent variables
c. levels of independent variables
d. independent variables
Post-hoc tests:
additional hypothesis tests, done after an ANOVA to
determine which mean differences are significant
and which not.
- not planned, not hypothesis driven
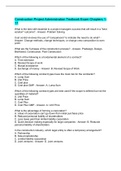
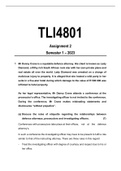
Partitioning variation
ANOVA assigns parts of total variance to
independent variables & their interaction in general
linear model.
Left out: unexplained/residual variance
Course objectives
To do well on the final examination, you should be able to do the following:
1. You can correctly describe in your own words the statistical jargon in this course.
For instance: p-value, effect size, backward elimination, variance inflation factor,
parsimony, planned comparisons, Bayes factor, likelihood, etc...
2. You can correctly interpret the output and outcome of the following statistical
procedures:
• Two-way ANOVA, including interactions and main effects, planned comparisons
using contrasts and post-hoc test.
• Multiple linear regression and model selection.
• Meta-analysis and forest plots.
• A Bayesian independent samples t-test.
3. You can name and explain in your own words what factors determine the power of
an experimental design and its statistical analysis.
4. You have used the G*Power software to calculate a sample size and perform a
formal power analysis for a 2-sample experimental design, a χ2 test of independence,
a linear regression.
5. You have developed a simple comprehensive search strategy and used the RevMan
software for data extraction and meta-analysis.
6. You have developed a sound critical attitude towards scientific claims in the
popular media.
Statistical analysis→ JASP
Power analysis & sample size calculations→ G*Power
Meta-analyses→ Meta-essentials
CHAPTER 3 – FACTORIAL DESIGNS
= measurements or observations recorded at various levels of two independent
variables or factors
mean response→ one-sided t-test for independent samples
difference bw mean responses→ one-way ANOVA
effect size = mean1 – mean2
Main effects: the separate effects of the factors
Interaction effect: whether the original independent variable depends on the level of
another independent variable
• df = df of two main effects
Interaction plot: shows mean or median of dependent variable for each combo of the
independent variables
, Factorial design & general linear model
Two-way ANOVA
Analyzes the variance within & between groups, classified by two independent
variables or factors. Most important feature: enables us to assess the interaction
(synergism, interference) between variables in the general linear model.
- does not say where exactly the difference is though
General Linear Model
A model of the form:
ylmn = µ + αl + βm + γlm + elmn
where:
y: response/result (e.g weight loss)
l: one independent variable
m: other independent variable
n: subject number (3rd person→ n = 3)
μ: constant representing overall mean of all observation
αl & βm: constants reflecting effects of the 2 independent variables
elm: error term including unexplained variance or variance within group← normally
distributed w mean 0
A two-way ANOVA analyzes data containing:
a. one independent variable with two levels
b. one dependent variable with two levels
c. two or more independent variables
d. two or more dependent variables
What are the factors in a two way ANOVA?
a. interactions between variables
b. dependent variables
c. levels of independent variables
d. independent variables
Post-hoc tests:
additional hypothesis tests, done after an ANOVA to
determine which mean differences are significant
and which not.
- not planned, not hypothesis driven
Partitioning variation
ANOVA assigns parts of total variance to
independent variables & their interaction in general
linear model.
Left out: unexplained/residual variance