, PLEASE USE THIS DOCUMENT AS A GUIDE TO ANSWER YOUR ASSIGNMENT
Question 1
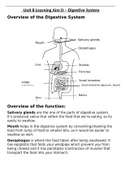
1.1. The diagram below shows small, black, grey and white triangles forming a pattern.
Diagra 2
The table below shows lhe number of triangles i111 each diagram_
Diagram 1 2 3 4 5 6 7 8 9 10
Smalll triangles 1 4 '9 16, 25 36
Black: tiriangle i 3 5 7 g 11.
Grey ~riangles 0 1 3 '6 10
White triangl:es 0 0 1 3 6 10
1.1.1. Analyse the four patterns presented in the table (Small triangles, Black triangles, Grey
triangles, and White triangles).
1.1.1.1. For each pattern, determine the first differences between consecutive terms.
Diagram 1 2 3 4 5 6
number n
Small 1 4 3 16 25 36
triangles
First +3 +5 +7 +9 +11
differences
Black 1 3 5 7 9 11
triangles
First +2 +2 +2 +2 +2
differences
Grey 0 1 3 6 10 -
triangles
First +1 +2 +3 +4 -
differences
White 0 0 1 3 6 10
triangles
First 0 +1 +2 +3 +4
differences
,1.1.1.2. Based on the differences, classify each pattern as either linear or quadratic.
Small‑triangle pattern: quadratic (first differences increase by a constant amount).
Black‑triangle pattern: linear (first differences are constant).
Grey‑triangle pattern: quadratic.
White‑triangle pattern: quadratic.
1.1.1.3. Provide a mathematical justification for your classification of the 'Small triangles' and
'Black triangles' patterns, referencing the concept of a 'constant difference' as a key feature of
linear sequences.
According to the standard definition of numeric sequences, a linear sequence is characterised by a
constant first difference between consecutive terms, while a quadratic sequence shows a constant
second difference (e.g. Stewart, 2020:45).
Black triangles: The first‑difference row is +2,+2,+2,+2,+2. Because this difference is
constant, the underlying rule can be written in the form Tn - an + b; hence the pattern is linear.
Small triangles: The first‑difference row is +3,+5,+7,+9,+11. These differences themselves
increase by a constant amount of +2. A constant second difference is the hallmark of a
quadratic rule of the form Tn - an2 + bn + c; therefore the pattern is quadratic.
1.1.2. The CAPS document emphasises representing patterns in various equivalent forms. For
the Grey and White triangle patterns:
1.1.2.1. Describe in words how each pattern grows from one diagram to the next.
Pattern How it grows from one diagram to the next
Grey triangles Each new diagram gets one extra grey triangle more than the previous
increase. In other words, you keep the grey triangles you already have and then
add a new “row” of n grey triangles along one edge, so the increases follow
+1, +2, +3, +4,…….
White triangles No white triangles appear until Diagram 3. From Diagram 3 onward, you again
keep what you have and then add one more white triangle than you added the
step before. The increases are +0,+1,+2, +3, +4,……………. (because the first
two diagrams add none).
The grey‑triangle totals therefore form the triangular‑number sequence
Gn = 0,1,3,6,10,…, while the white‑triangle totals lag by two diagrams:
Wn = 0,0,1,3,6,10,….
, 1.1.2.2. Design two separate flow diagrams that model the process of finding the number of
triangles (output) for any given diagram number (input, n). This task assesses your ability to
translate a recursive relationship into a visual teaching tool that supports learner understanding.
Grey‑triangle pattern (triangular numbers)
┌──────────┐
│ Start │
└────┬─────┘
│
┌────▼────┐
│ Input n │
└────┬────┘
│
┌────▼────┐ initialise running total
│ total=0 │
└────┬────┘
│
┌────▼────┐ initialise counter
│ k=1 │
└────┬────┘
│
┌────▼────┐
│ k < n ? │──────────No──────────┐
└────┬────┘ │
│Yes │
┌────▼────┐ │
│total←total+k│ │
└────┬────┘ │
│ │
┌────▼────┐ │
│ k←k+1 │ │
└────┬────┘ │ loop
└───────────<───────────────┘
|
┌───────────▼───────────┐
│ Output “total” (Gₙ) │
└───────────┬───────────┘
│
┌───▼───┐
│ End │
└───────┘
Mathematically the same result is given by the closed form
G. - n ( n - 1 )
•
2
Question 1
1.1. The diagram below shows small, black, grey and white triangles forming a pattern.
Diagra 2
The table below shows lhe number of triangles i111 each diagram_
Diagram 1 2 3 4 5 6 7 8 9 10
Smalll triangles 1 4 '9 16, 25 36
Black: tiriangle i 3 5 7 g 11.
Grey ~riangles 0 1 3 '6 10
White triangl:es 0 0 1 3 6 10
1.1.1. Analyse the four patterns presented in the table (Small triangles, Black triangles, Grey
triangles, and White triangles).
1.1.1.1. For each pattern, determine the first differences between consecutive terms.
Diagram 1 2 3 4 5 6
number n
Small 1 4 3 16 25 36
triangles
First +3 +5 +7 +9 +11
differences
Black 1 3 5 7 9 11
triangles
First +2 +2 +2 +2 +2
differences
Grey 0 1 3 6 10 -
triangles
First +1 +2 +3 +4 -
differences
White 0 0 1 3 6 10
triangles
First 0 +1 +2 +3 +4
differences
,1.1.1.2. Based on the differences, classify each pattern as either linear or quadratic.
Small‑triangle pattern: quadratic (first differences increase by a constant amount).
Black‑triangle pattern: linear (first differences are constant).
Grey‑triangle pattern: quadratic.
White‑triangle pattern: quadratic.
1.1.1.3. Provide a mathematical justification for your classification of the 'Small triangles' and
'Black triangles' patterns, referencing the concept of a 'constant difference' as a key feature of
linear sequences.
According to the standard definition of numeric sequences, a linear sequence is characterised by a
constant first difference between consecutive terms, while a quadratic sequence shows a constant
second difference (e.g. Stewart, 2020:45).
Black triangles: The first‑difference row is +2,+2,+2,+2,+2. Because this difference is
constant, the underlying rule can be written in the form Tn - an + b; hence the pattern is linear.
Small triangles: The first‑difference row is +3,+5,+7,+9,+11. These differences themselves
increase by a constant amount of +2. A constant second difference is the hallmark of a
quadratic rule of the form Tn - an2 + bn + c; therefore the pattern is quadratic.
1.1.2. The CAPS document emphasises representing patterns in various equivalent forms. For
the Grey and White triangle patterns:
1.1.2.1. Describe in words how each pattern grows from one diagram to the next.
Pattern How it grows from one diagram to the next
Grey triangles Each new diagram gets one extra grey triangle more than the previous
increase. In other words, you keep the grey triangles you already have and then
add a new “row” of n grey triangles along one edge, so the increases follow
+1, +2, +3, +4,…….
White triangles No white triangles appear until Diagram 3. From Diagram 3 onward, you again
keep what you have and then add one more white triangle than you added the
step before. The increases are +0,+1,+2, +3, +4,……………. (because the first
two diagrams add none).
The grey‑triangle totals therefore form the triangular‑number sequence
Gn = 0,1,3,6,10,…, while the white‑triangle totals lag by two diagrams:
Wn = 0,0,1,3,6,10,….
, 1.1.2.2. Design two separate flow diagrams that model the process of finding the number of
triangles (output) for any given diagram number (input, n). This task assesses your ability to
translate a recursive relationship into a visual teaching tool that supports learner understanding.
Grey‑triangle pattern (triangular numbers)
┌──────────┐
│ Start │
└────┬─────┘
│
┌────▼────┐
│ Input n │
└────┬────┘
│
┌────▼────┐ initialise running total
│ total=0 │
└────┬────┘
│
┌────▼────┐ initialise counter
│ k=1 │
└────┬────┘
│
┌────▼────┐
│ k < n ? │──────────No──────────┐
└────┬────┘ │
│Yes │
┌────▼────┐ │
│total←total+k│ │
└────┬────┘ │
│ │
┌────▼────┐ │
│ k←k+1 │ │
└────┬────┘ │ loop
└───────────<───────────────┘
|
┌───────────▼───────────┐
│ Output “total” (Gₙ) │
└───────────┬───────────┘
│
┌───▼───┐
│ End │
└───────┘
Mathematically the same result is given by the closed form
G. - n ( n - 1 )
•
2