Lectures week 1: Portfolio theory
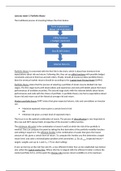
The traditional process of investing follows the chain below:
Portfolio theory is concerned with the first link in the chain, which is about how investors form
expectations about risk and return. Following this, they set up utility functions with possible budget
constraints and put in their buy and sell orders. Finally, should all investors follow portfolio theory
then the eventual market returns should be according to the Capital Asset Pricing Model (CAPM).
Portfolio theory states that the process of selecting a portfolio of stocks may be divided into two
stages. The first stage starts with observations and experience and ends with beliefs about the future
performances of available securities. The second stage starts with the relevant beliefs about future
performances and ends with the choice of portfolio. In portfolio theory one forms expectations about
future risk and return out of the historical average risk and return.
Modern portfolio theory (MPT) states that given expected returns, risks and correlations an investor
can:
Maximize expected returns given a certain level of risk
OR
Minimize risk given a certain level of expected return
The focus is on the optimal combination of assets. The process of diversification is very important in
this case and MPT always holds, irrespective of the investor’s utility function.
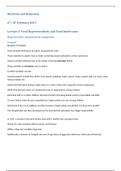
The minimum risk point is the combination of asset A and B at which the risk of the portfolio is
minimal. One can compute this point by taking the first derivative of the portfolio volatility function
and setting it equal to 0. The efficient frontier is the combination of assets that gives the lowest
amount of risk, given a certain level of return. To compute this frontier you first determine a target
'
return level, and solve a minimalization problem with constraints: ώ Ŕ=R target (expected return =
target), weights sum up to 1 and ω F ≫ 0 (no short-selling).
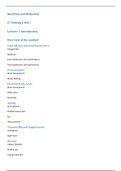
If one can borrow at the risk-free rate (F), a new efficient frontier line can be established (see below)
also called the Capital market line. Where this line is tangent with the efficient frontier is where the
market portfolio (M) is. At this point the Sharpe ratio (excess return/volatility) is at its maximum.
,Lecture week 1: Basic utility
From portfolio theory it follows that all investors should hold a combination of the risk-free asset and
the market portfolio. Utility functions can be used to determine for each individual investor the
amount of money they want to put into the market portfolio. To determine these functions we can
use the Von Neuman Morgenstern (VNM) expected utility theory. This theory states that the utility
attached to a set of probabilistic outcomes is simply the cumulative of the utility of the outcomes,
weighted by the probabilities attached to them. Decision-makers who are facing risky outcomes will
thus behave as if they are maximizing the expected value of some function (utility function) over the
potential outcomes,
The VNM expected utility theory poses several axioms of rationality:
Completeness: this axiom states that investors always have an opinion in the form of a
preference for one or the other option or they are indifferent.
Transitivity: this states that investors are consistent in their preferences. Say you prefer
apples over pears and you prefer pears over bananas, then it follows that you prefer apples
over bananas.
Continuity: say again that you have the following preferences: apples > pears > bananas.
Then you can make a combination between apples and bananas that would make you
equally happy as with a banana. You can thus create a continuous combination between
options.
Independence: If you prefer apples over pears, then you should also prefer the option of one
apple and a banana over the option of one pear and a banana. This axiom essentially
establishes that no matter how the option is presented, your preferences should hold.
Now with regard to utility functions we can state the following:
,We want to maximize our expected utility in period 1, as can be seen from the function at the
bottom. But what should the utility function (where we input wealth) actually be? Often a quadratic
(or: mean-variance, meaning that we like more wealth/returns but we dislike more
variance/uncertainty/risk in wealth) utility function is used, which has the following form:
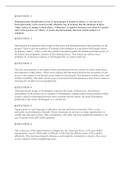
In this function, b can be interpreted as the measure of risk aversion, such that the higher b is, the
higher the amount of risk-aversion (given that there is a minus sign). Given that the second derivative
of this function, with respect to the variance of wealth, yields a negative b, we can state that the
investor experiences decreasing marginal utility of wealth in this case risk-aversion follows from that.
From the expected utility function above we can determine what variables are known and which
ones are unknown and rewrite:
, We maximize to get the demand for the market portfolio, by taking the first derivative, with respect
to x m and setting it equal to 0. The eventual function we then get tells us the optimal amount the
mean-variance optimizing investor will put into the market portfolio.
Intuitively, the eventual function tells us the following things:
The higher the return premium on the market (either due to a higher return in the market or
a lower risk-free return), the more the investor will invest in the market portfolio.
The higher the risk-aversion (b) of the investor, the less they will invest in the market
portfolio.
The higher the initial wealth of the investor, the less they invest in the stock market (which is
empirically not the case, it is actually the other way around).
The higher the risk of investing in the stock market (V), the less the investor will invest in the
market portfolio.
Lecture week 1: CAPM
The CAPM tries to answer the question: What is the relationship between risk and expected return
for stocks? So if all investors actually use portfolio theory, then how should assets be priced in
equilibrium?
In equilibrium, all assets (i) should have the same marginal utility (k). This follows from the equation
below. The assets all earn a return and all have a covariance with the returns of the market. The
marginal utility derived from an asset is thus the return it adds, minus the risk-aversion of the
investor times the covariance of the asset with the market:
The ultimate reason that the marginal utility of all assets should be a constant in equilibrium is
because if there is an asset that earns a return that is ‘too’ high, relative to the risk it carries, then
investors will flock towards the asset and the price of it will increase, thereby lowering the return.
This works the other way around for assets that earn a return that is ‘too’ low, relative to the risk it
carries.
If we fill in the equation above for the risk-free rate (which we know to be uncorrelated with the
market since it carries no risk), we get:
Thus we know that k equals the risk-free rate. Subsequently we can fill the equation in for the market
portfolio and for a general asset (i) to get the formula of the CAPM:
The traditional process of investing follows the chain below:
Portfolio theory is concerned with the first link in the chain, which is about how investors form
expectations about risk and return. Following this, they set up utility functions with possible budget
constraints and put in their buy and sell orders. Finally, should all investors follow portfolio theory
then the eventual market returns should be according to the Capital Asset Pricing Model (CAPM).
Portfolio theory states that the process of selecting a portfolio of stocks may be divided into two
stages. The first stage starts with observations and experience and ends with beliefs about the future
performances of available securities. The second stage starts with the relevant beliefs about future
performances and ends with the choice of portfolio. In portfolio theory one forms expectations about
future risk and return out of the historical average risk and return.
Modern portfolio theory (MPT) states that given expected returns, risks and correlations an investor
can:
Maximize expected returns given a certain level of risk
OR
Minimize risk given a certain level of expected return
The focus is on the optimal combination of assets. The process of diversification is very important in
this case and MPT always holds, irrespective of the investor’s utility function.
The minimum risk point is the combination of asset A and B at which the risk of the portfolio is
minimal. One can compute this point by taking the first derivative of the portfolio volatility function
and setting it equal to 0. The efficient frontier is the combination of assets that gives the lowest
amount of risk, given a certain level of return. To compute this frontier you first determine a target
'
return level, and solve a minimalization problem with constraints: ώ Ŕ=R target (expected return =
target), weights sum up to 1 and ω F ≫ 0 (no short-selling).
If one can borrow at the risk-free rate (F), a new efficient frontier line can be established (see below)
also called the Capital market line. Where this line is tangent with the efficient frontier is where the
market portfolio (M) is. At this point the Sharpe ratio (excess return/volatility) is at its maximum.
,Lecture week 1: Basic utility
From portfolio theory it follows that all investors should hold a combination of the risk-free asset and
the market portfolio. Utility functions can be used to determine for each individual investor the
amount of money they want to put into the market portfolio. To determine these functions we can
use the Von Neuman Morgenstern (VNM) expected utility theory. This theory states that the utility
attached to a set of probabilistic outcomes is simply the cumulative of the utility of the outcomes,
weighted by the probabilities attached to them. Decision-makers who are facing risky outcomes will
thus behave as if they are maximizing the expected value of some function (utility function) over the
potential outcomes,
The VNM expected utility theory poses several axioms of rationality:
Completeness: this axiom states that investors always have an opinion in the form of a
preference for one or the other option or they are indifferent.
Transitivity: this states that investors are consistent in their preferences. Say you prefer
apples over pears and you prefer pears over bananas, then it follows that you prefer apples
over bananas.
Continuity: say again that you have the following preferences: apples > pears > bananas.
Then you can make a combination between apples and bananas that would make you
equally happy as with a banana. You can thus create a continuous combination between
options.
Independence: If you prefer apples over pears, then you should also prefer the option of one
apple and a banana over the option of one pear and a banana. This axiom essentially
establishes that no matter how the option is presented, your preferences should hold.
Now with regard to utility functions we can state the following:
,We want to maximize our expected utility in period 1, as can be seen from the function at the
bottom. But what should the utility function (where we input wealth) actually be? Often a quadratic
(or: mean-variance, meaning that we like more wealth/returns but we dislike more
variance/uncertainty/risk in wealth) utility function is used, which has the following form:
In this function, b can be interpreted as the measure of risk aversion, such that the higher b is, the
higher the amount of risk-aversion (given that there is a minus sign). Given that the second derivative
of this function, with respect to the variance of wealth, yields a negative b, we can state that the
investor experiences decreasing marginal utility of wealth in this case risk-aversion follows from that.
From the expected utility function above we can determine what variables are known and which
ones are unknown and rewrite:
, We maximize to get the demand for the market portfolio, by taking the first derivative, with respect
to x m and setting it equal to 0. The eventual function we then get tells us the optimal amount the
mean-variance optimizing investor will put into the market portfolio.
Intuitively, the eventual function tells us the following things:
The higher the return premium on the market (either due to a higher return in the market or
a lower risk-free return), the more the investor will invest in the market portfolio.
The higher the risk-aversion (b) of the investor, the less they will invest in the market
portfolio.
The higher the initial wealth of the investor, the less they invest in the stock market (which is
empirically not the case, it is actually the other way around).
The higher the risk of investing in the stock market (V), the less the investor will invest in the
market portfolio.
Lecture week 1: CAPM
The CAPM tries to answer the question: What is the relationship between risk and expected return
for stocks? So if all investors actually use portfolio theory, then how should assets be priced in
equilibrium?
In equilibrium, all assets (i) should have the same marginal utility (k). This follows from the equation
below. The assets all earn a return and all have a covariance with the returns of the market. The
marginal utility derived from an asset is thus the return it adds, minus the risk-aversion of the
investor times the covariance of the asset with the market:
The ultimate reason that the marginal utility of all assets should be a constant in equilibrium is
because if there is an asset that earns a return that is ‘too’ high, relative to the risk it carries, then
investors will flock towards the asset and the price of it will increase, thereby lowering the return.
This works the other way around for assets that earn a return that is ‘too’ low, relative to the risk it
carries.
If we fill in the equation above for the risk-free rate (which we know to be uncorrelated with the
market since it carries no risk), we get:
Thus we know that k equals the risk-free rate. Subsequently we can fill the equation in for the market
portfolio and for a general asset (i) to get the formula of the CAPM: