FINAL EXAM QUESTIONS
Extra Credit - 4 questions
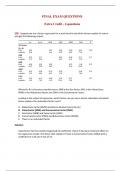
Q1) Suppose we run a factor regression for a stock fund to see which factors explain its return
and get the following output:
Where RM-RF is the excess market return, SMB is the Size factor, HML is the Value factor,
RMW is the Robustness factor and CMA is the Conservative Factor.
Looking at the output of regression, which factor can you say is almost redundant and which
factor explains the redundant factor most?
A. Robustness Factor (RMW) and Excess-Market return (RM-RF)
B. Value Factor (HML) and Conservative Factor (CMA)
C. Size Factor (SMB) and Value Factor (HML)
D. Conservative Factor (CMA) and Robustness Factor (RMW)
E. There is no redundant factor
Solution:
Value factor has the smallest magnitude of coefficient. Hence it has bare minimum effect on
the regression model. The factor that explains it most is Conservative Factor (CMA) with a
coefficient of 1.04 and t-stat of 23.
, Instructions for Q2 and Q3
Please use the Facebook Ad dataset KAG_conversion_data_wrangled.csv for the next set of
questions. You should solve these questions using R (preferably using dplyr library wherever
applicable) after reviewing the code provided for Week 11 and other resources provided for
learning dplyr in R Learning Guide. Load the dataset as:
data <-
read.csv("KAG_conversion_data_wrangled.csv",stringsAsFactors =
FALSE)
Organic Impressions are ads that have generated impressions without any money spent on
them. (i.e. Spent = 0).
Q2)
Which campaign (campaign_id) has produced least number of ads with organic
impressions?
Answer: 1178
Code: data %>% filter(Spent == 0 & Impressions > 0) %>% group_by(campaign_id) %>%
summarise(n_ads = length(ad_id)) %>% arrange(n_ads)
Q3)
Among ads with organic impressions, which ad (ad_id) has the highest number of
impressions?
Answer: 1121094
Code: data %>% filter(Spent == 0 & Impressions > 0) %>% filter(Impressions ==
max(Impressions)) %>% select(ad_id)
Q4) (Continuation of Q18-20 in Part 1 of final)
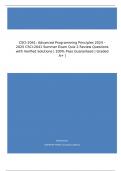
Bobby Dodd works at Football Inc., a seller of high-quality footballs. He is interested in
forecasting demand for his footballs that are sold weekly to Ga Tech using exponential
smoothing. Assume an initial forecast of 175 and the demand data below:
Week Demand Forecast
1 180 175
2 168
Extra Credit - 4 questions
Q1) Suppose we run a factor regression for a stock fund to see which factors explain its return
and get the following output:
Where RM-RF is the excess market return, SMB is the Size factor, HML is the Value factor,
RMW is the Robustness factor and CMA is the Conservative Factor.
Looking at the output of regression, which factor can you say is almost redundant and which
factor explains the redundant factor most?
A. Robustness Factor (RMW) and Excess-Market return (RM-RF)
B. Value Factor (HML) and Conservative Factor (CMA)
C. Size Factor (SMB) and Value Factor (HML)
D. Conservative Factor (CMA) and Robustness Factor (RMW)
E. There is no redundant factor
Solution:
Value factor has the smallest magnitude of coefficient. Hence it has bare minimum effect on
the regression model. The factor that explains it most is Conservative Factor (CMA) with a
coefficient of 1.04 and t-stat of 23.
, Instructions for Q2 and Q3
Please use the Facebook Ad dataset KAG_conversion_data_wrangled.csv for the next set of
questions. You should solve these questions using R (preferably using dplyr library wherever
applicable) after reviewing the code provided for Week 11 and other resources provided for
learning dplyr in R Learning Guide. Load the dataset as:
data <-
read.csv("KAG_conversion_data_wrangled.csv",stringsAsFactors =
FALSE)
Organic Impressions are ads that have generated impressions without any money spent on
them. (i.e. Spent = 0).
Q2)
Which campaign (campaign_id) has produced least number of ads with organic
impressions?
Answer: 1178
Code: data %>% filter(Spent == 0 & Impressions > 0) %>% group_by(campaign_id) %>%
summarise(n_ads = length(ad_id)) %>% arrange(n_ads)
Q3)
Among ads with organic impressions, which ad (ad_id) has the highest number of
impressions?
Answer: 1121094
Code: data %>% filter(Spent == 0 & Impressions > 0) %>% filter(Impressions ==
max(Impressions)) %>% select(ad_id)
Q4) (Continuation of Q18-20 in Part 1 of final)
Bobby Dodd works at Football Inc., a seller of high-quality footballs. He is interested in
forecasting demand for his footballs that are sold weekly to Ga Tech using exponential
smoothing. Assume an initial forecast of 175 and the demand data below:
Week Demand Forecast
1 180 175
2 168