Week 1:
Article: Risk, Return and Equilibrium empirical tests (Fama, 1973):
Short summary: the article aims to test the relationship between risk and average return on stocks.
Furthermore, it is not able to reject the hypothesis that investors hold portfolios that are efficient in
terms of expected value and dispersion of return. Finally, it finds that risk-return properties are in
line with an efficient capital market (a market in which the prices of securities fully reflect available
information).
The assumption of efficient capital markets and the CAPM model leaves us with three testable
implications:
1. The relationship between the expected return on a security and its risk in any efficient
portfolio (m) is linear.
2. The beta of a security is its complete measure of risk in the efficient portfolio m.
3. In a market of risk-averse investors, higher risk should be associated with higher expected
return.
Should assumption 1 and 2 not hold, then market returns do not reflect the attempts of investors to
hold efficient portfolios. This would mean that some assets are systematically under- or overpriced
relative to what is implied by the expected return-risk or efficiency equation.
The paper continues to establish ways to test these three hypotheses. To test the three conditions
one must identify some efficient portfolio (referred to by the letter m). It can be shown that the
market portfolio is always efficient, therefore this portfolio shall be utilized. The following model of
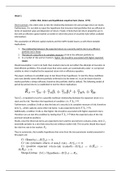
period-by-period returns is established to test the three implications.
Term ~γ 2 t is inputted to test for a possible nonlinear relationship between the expected return on a
stock and its risk. Therefore the hypothesis of condition 1 is: E ( ~γ 2 t ) =0.
Furthermore, condition 2 tells us that the beta of a security is its complete measure of risk, therefore
term ~γ 3 t , which captures some other risk factor, is also expected to be 0 ( E ( ~γ 3 t ) =0).
Additionally, condition 3 tells us that higher risk should be associated with higher expected return.
Therefore we can test this condition by testing that E ( ~γ 1 t ) > 0 (that the expected value of the risk
premium should be positive).
Finally, since the three last terms are expected to be 0 and the second term contains a beta, term ~γ 1 t
essentially pertains to a zero-beta security (one without market risk). This security should thus equal
the risk free rate in the market: R ft.
Thus to summarize, the testable hypotheses that arise from the two-parameter model presented in
this paper are:
,The paper tests all of the above hypotheses:
First off, it finds that ~γ 2 t does not significantly differ from 0. Therefore it does not find
evidence against condition 1 (that there is a linear relationship between expected return and
risk of a stock).
It finds that condition 2 (there is no measure of risk, in addition to beta, that systematically
affects expected stock returns) cannot be rejected. The measure ~γ 3 t does not significantly
differ from 0.
It finds that ~γ 1 t is significantly greater than 0, therefore it finds evidence in favor of condition
3, which states that there is a positive relationship between (market) risk of a stock and its
expected return.
The paper further finds evidence in favor of the hypothesis that the capital market they researched is
efficient. This is concluded based on the fact that serial correlations (the explanatory power of the
previous period’s returns over the next period’s returns) are close to 0.
In summary: the paper finds support for the testable implications of its two-parameter model. Given
that its proxy for the market portfolio is approximately efficient the authors cannot reject the
hypothesis that average stock returns reflect attempts of risk-averse investors to hold efficient
portfolios. It essentially finds evidence for an efficient capital market (one in which the prices of
securities fully reflect available information).
Week 2:
Article: The cross-section of expected stock returns (Fama, 1992)
Short summary: This article establishes the variables size and Book-to-Market ratio (B/M ratio) as
being able to capture cross-sectional variation in average stock returns.
The CAPM model, states that the market risk of a stock should perfectly explain its returns. However,
a size effect which is often found is that small cap stocks seem to generally have too high returns for
their betas and that average returns on large stocks are too low. Additionally, a B/M effect has also
been found, due to which firms with a higher B/M ratio generally seem to have higher returns than
firms with lower B/M ratios. Finally, leverage and Earnings/Price ratio also seem to explain some
cross-sectional variation in stock returns. This paper explores all of these effects on the cross-
sectional variation of stock returns.
Finally this paper finds that:
Market beta does not seem to help explain the cross-section of average stock returns .
B/M ratio and size seem to explain the cross-sectional variation in stock returns .
The combination of size and B/M ratio seem to absorb the roles of leverage and E/P in
average returns (thus making these last variables less interesting for explaining stock
returns).
The reasoning behind the B/M factor being a priced risk factor is the following. The B/M ratio might
capture the relative distress a firm is in. Firms that the market judges to have poor earnings
prospects will have lower stock prices and high ratios of book-to-market, these firms will thus have
higher expected stock returns (explaining the B/M effect).
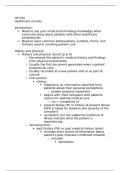
, The table below shows a sort of betas and size of portfolios. The relationship between the size, beta
and average returns of these portfolios give a clear interpretation. There is a negative effect of size
on average stock returns, but there is no effect of market beta on average stock returns when a
correction for size is applied (the additional ranking on size).
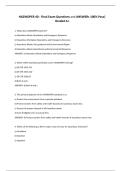
The paper also goes into the effect of B/M ratio on cross-sectional stock returns. It finds that the
effect of this variable on stock returns is even stronger than the size effect. The table below shows
that average returns of portfolios increase with B/M ratio and that this relationship cannot be
disguised by an effect of market beta, since these vary little across the B/M ratio ranked portfolios.
The paper states that there are two equivalent ways to interpret the B/M effect in average stock
returns:
1. A high B/M ratio says that the market judges the prospects if a firm to be poor relative to
firms with lower B/M (due to its lower market value). Thus it may capture a risk premium for
distress.
2. A high B/M ratio also says that a firm’s market leverage is high relative to its book leverage.
Thus the firm has a large amount of market-imposed leverage because the market judges
that its prospects are poor and discounts its stock price relative to book value.
The table below shows that, controlling for the effect of B/M ratio, size seems to explain cross-
sectional variation in stock returns. It also tells us that, controlling for the effect of size, B/M ratio
seems to also explain cross-sectional variation in stock returns.
There is an interaction between size and B/M ratio. Namely, stocks with low market equity (size) are
more likely to have poor prospects, resulting in low stock prices and a high B/M ratio. Conversely,
large stocks are more likely to be firms with stronger prospects, higher stock prices (and thus size),
lower B/M ratio and lower average stock returns.
Article: Risk, Return and Equilibrium empirical tests (Fama, 1973):
Short summary: the article aims to test the relationship between risk and average return on stocks.
Furthermore, it is not able to reject the hypothesis that investors hold portfolios that are efficient in
terms of expected value and dispersion of return. Finally, it finds that risk-return properties are in
line with an efficient capital market (a market in which the prices of securities fully reflect available
information).
The assumption of efficient capital markets and the CAPM model leaves us with three testable
implications:
1. The relationship between the expected return on a security and its risk in any efficient
portfolio (m) is linear.
2. The beta of a security is its complete measure of risk in the efficient portfolio m.
3. In a market of risk-averse investors, higher risk should be associated with higher expected
return.
Should assumption 1 and 2 not hold, then market returns do not reflect the attempts of investors to
hold efficient portfolios. This would mean that some assets are systematically under- or overpriced
relative to what is implied by the expected return-risk or efficiency equation.
The paper continues to establish ways to test these three hypotheses. To test the three conditions
one must identify some efficient portfolio (referred to by the letter m). It can be shown that the
market portfolio is always efficient, therefore this portfolio shall be utilized. The following model of
period-by-period returns is established to test the three implications.
Term ~γ 2 t is inputted to test for a possible nonlinear relationship between the expected return on a
stock and its risk. Therefore the hypothesis of condition 1 is: E ( ~γ 2 t ) =0.
Furthermore, condition 2 tells us that the beta of a security is its complete measure of risk, therefore
term ~γ 3 t , which captures some other risk factor, is also expected to be 0 ( E ( ~γ 3 t ) =0).
Additionally, condition 3 tells us that higher risk should be associated with higher expected return.
Therefore we can test this condition by testing that E ( ~γ 1 t ) > 0 (that the expected value of the risk
premium should be positive).
Finally, since the three last terms are expected to be 0 and the second term contains a beta, term ~γ 1 t
essentially pertains to a zero-beta security (one without market risk). This security should thus equal
the risk free rate in the market: R ft.
Thus to summarize, the testable hypotheses that arise from the two-parameter model presented in
this paper are:
,The paper tests all of the above hypotheses:
First off, it finds that ~γ 2 t does not significantly differ from 0. Therefore it does not find
evidence against condition 1 (that there is a linear relationship between expected return and
risk of a stock).
It finds that condition 2 (there is no measure of risk, in addition to beta, that systematically
affects expected stock returns) cannot be rejected. The measure ~γ 3 t does not significantly
differ from 0.
It finds that ~γ 1 t is significantly greater than 0, therefore it finds evidence in favor of condition
3, which states that there is a positive relationship between (market) risk of a stock and its
expected return.
The paper further finds evidence in favor of the hypothesis that the capital market they researched is
efficient. This is concluded based on the fact that serial correlations (the explanatory power of the
previous period’s returns over the next period’s returns) are close to 0.
In summary: the paper finds support for the testable implications of its two-parameter model. Given
that its proxy for the market portfolio is approximately efficient the authors cannot reject the
hypothesis that average stock returns reflect attempts of risk-averse investors to hold efficient
portfolios. It essentially finds evidence for an efficient capital market (one in which the prices of
securities fully reflect available information).
Week 2:
Article: The cross-section of expected stock returns (Fama, 1992)
Short summary: This article establishes the variables size and Book-to-Market ratio (B/M ratio) as
being able to capture cross-sectional variation in average stock returns.
The CAPM model, states that the market risk of a stock should perfectly explain its returns. However,
a size effect which is often found is that small cap stocks seem to generally have too high returns for
their betas and that average returns on large stocks are too low. Additionally, a B/M effect has also
been found, due to which firms with a higher B/M ratio generally seem to have higher returns than
firms with lower B/M ratios. Finally, leverage and Earnings/Price ratio also seem to explain some
cross-sectional variation in stock returns. This paper explores all of these effects on the cross-
sectional variation of stock returns.
Finally this paper finds that:
Market beta does not seem to help explain the cross-section of average stock returns .
B/M ratio and size seem to explain the cross-sectional variation in stock returns .
The combination of size and B/M ratio seem to absorb the roles of leverage and E/P in
average returns (thus making these last variables less interesting for explaining stock
returns).
The reasoning behind the B/M factor being a priced risk factor is the following. The B/M ratio might
capture the relative distress a firm is in. Firms that the market judges to have poor earnings
prospects will have lower stock prices and high ratios of book-to-market, these firms will thus have
higher expected stock returns (explaining the B/M effect).
, The table below shows a sort of betas and size of portfolios. The relationship between the size, beta
and average returns of these portfolios give a clear interpretation. There is a negative effect of size
on average stock returns, but there is no effect of market beta on average stock returns when a
correction for size is applied (the additional ranking on size).
The paper also goes into the effect of B/M ratio on cross-sectional stock returns. It finds that the
effect of this variable on stock returns is even stronger than the size effect. The table below shows
that average returns of portfolios increase with B/M ratio and that this relationship cannot be
disguised by an effect of market beta, since these vary little across the B/M ratio ranked portfolios.
The paper states that there are two equivalent ways to interpret the B/M effect in average stock
returns:
1. A high B/M ratio says that the market judges the prospects if a firm to be poor relative to
firms with lower B/M (due to its lower market value). Thus it may capture a risk premium for
distress.
2. A high B/M ratio also says that a firm’s market leverage is high relative to its book leverage.
Thus the firm has a large amount of market-imposed leverage because the market judges
that its prospects are poor and discounts its stock price relative to book value.
The table below shows that, controlling for the effect of B/M ratio, size seems to explain cross-
sectional variation in stock returns. It also tells us that, controlling for the effect of size, B/M ratio
seems to also explain cross-sectional variation in stock returns.
There is an interaction between size and B/M ratio. Namely, stocks with low market equity (size) are
more likely to have poor prospects, resulting in low stock prices and a high B/M ratio. Conversely,
large stocks are more likely to be firms with stronger prospects, higher stock prices (and thus size),
lower B/M ratio and lower average stock returns.