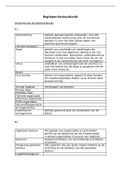
Relias Dysrhythmia Basic. Well Elaborated Study Guide 2025 -
2026
How is your patient tolerating this rhythm?
-Is the patient in distress?
-Diaphoresis -Increase HR -SOB -Decrease BP
-Increase RR -Nausea/vomiting -Chest pain
**12 Lead EKG does not diagnosis a rhythm but it displays if the heart is
experiencing ischemia or infarction What would you assess?
-Oxygen
-Usually assessed based on if the patient is verbally communicating
-Pulse
-Patient’s BP (perfusion)
-Ask the patient if they are experiencing dizziness, SOB, feeling of faintness, & presence
of chest pain?
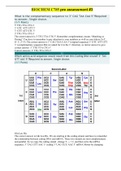
What would you do if you saw this rhythm?
*In between each black line is 3 sec = 15 boxes *This strip is 6 sec = 30 boxes
**V-Tach
-Wide -Low cardiac output
, Relias Dysrhythmia Basic. Well Elaborated Study Guide 2025 -
2026
Conduction System of the Heart
-SA Node: Pacemaker of the heart
-Spreads electrical impulses to the left and right atrium (atrial depolarization) & pauses
at the AV node
-Inferior wall MI is notorious
-AV Node: Atrial contraction occurs
-Atrial depolarization (represented by the p wave) = 0.12-0.20ms
-Mechanical contraction of the atrium (represented by a present pulse)
-Ventricle depolarization: Represented by the QRS wave = < 0.10ms
-Ventricle Repolarization: Represented by the T wave
-Ischemia = Right & left bundle branch block = wider QRS > 0.10ms = V-Tach
**Telemetry strip = 12 images of the heart
***Demonstrating electrical current moving towards the leads (action potential). Cells
are needed to transmit the action potential in order to have a contraction.
, Relias Dysrhythmia Basic. Well Elaborated Study Guide 2025 -
2026
**Blood Pressure represents atrial and ventricle squeeze = cardiac output -
Decent BP: 110/70
-Concerning BP: Systolic < 90
-Ex: 80/50
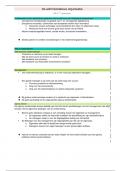
Electrocardiogram Monitoring
1. The P wave represents time for the passage of the electrical impulse through the
atrium causing atrial depolarization (contraction).
2. The P-R interval is measured from the beginning of the P wave to the beginning of the
QRS complex. It represents the time taken for the impulse to spread through the atria,
AV node, and bundle of His; the bundle branches; and Purkinje fibers to a point
immediately preceding ventricular contraction.
*Takes 0.12-0.20ms = 3-5 little boxes
3. The QRS complex consists of three distinct waves.
-The Q wave is the first negative (downward) deflection after the P wave, short and
narrow, and not present in several leads.
-The R wave is the first positive (upward) deflection in the QRS complex -
S wave is the first negative (downward) deflection after the R wave.
*The QRS interval is measured from the beginning to the end of the QRS complex. It
represents the time
Taken for depolarization (contraction) of both ventricles (systole).
2026
How is your patient tolerating this rhythm?
-Is the patient in distress?
-Diaphoresis -Increase HR -SOB -Decrease BP
-Increase RR -Nausea/vomiting -Chest pain
**12 Lead EKG does not diagnosis a rhythm but it displays if the heart is
experiencing ischemia or infarction What would you assess?
-Oxygen
-Usually assessed based on if the patient is verbally communicating
-Pulse
-Patient’s BP (perfusion)
-Ask the patient if they are experiencing dizziness, SOB, feeling of faintness, & presence
of chest pain?
What would you do if you saw this rhythm?
*In between each black line is 3 sec = 15 boxes *This strip is 6 sec = 30 boxes
**V-Tach
-Wide -Low cardiac output
, Relias Dysrhythmia Basic. Well Elaborated Study Guide 2025 -
2026
Conduction System of the Heart
-SA Node: Pacemaker of the heart
-Spreads electrical impulses to the left and right atrium (atrial depolarization) & pauses
at the AV node
-Inferior wall MI is notorious
-AV Node: Atrial contraction occurs
-Atrial depolarization (represented by the p wave) = 0.12-0.20ms
-Mechanical contraction of the atrium (represented by a present pulse)
-Ventricle depolarization: Represented by the QRS wave = < 0.10ms
-Ventricle Repolarization: Represented by the T wave
-Ischemia = Right & left bundle branch block = wider QRS > 0.10ms = V-Tach
**Telemetry strip = 12 images of the heart
***Demonstrating electrical current moving towards the leads (action potential). Cells
are needed to transmit the action potential in order to have a contraction.
, Relias Dysrhythmia Basic. Well Elaborated Study Guide 2025 -
2026
**Blood Pressure represents atrial and ventricle squeeze = cardiac output -
Decent BP: 110/70
-Concerning BP: Systolic < 90
-Ex: 80/50
Electrocardiogram Monitoring
1. The P wave represents time for the passage of the electrical impulse through the
atrium causing atrial depolarization (contraction).
2. The P-R interval is measured from the beginning of the P wave to the beginning of the
QRS complex. It represents the time taken for the impulse to spread through the atria,
AV node, and bundle of His; the bundle branches; and Purkinje fibers to a point
immediately preceding ventricular contraction.
*Takes 0.12-0.20ms = 3-5 little boxes
3. The QRS complex consists of three distinct waves.
-The Q wave is the first negative (downward) deflection after the P wave, short and
narrow, and not present in several leads.
-The R wave is the first positive (upward) deflection in the QRS complex -
S wave is the first negative (downward) deflection after the R wave.
*The QRS interval is measured from the beginning to the end of the QRS complex. It
represents the time
Taken for depolarization (contraction) of both ventricles (systole).