PROBLEM 1
Part A
Summary: Descriptive Statistics
Mean: BBLS ≈ 9,165 barrels; Sales ≈ $2,289,489.
Median: BBLS = 6,268.8; Sales = $1,481,759.
Mode: None (all values are unique; no repeated value).
Standard Deviation: BBLS ≈ 7,445; Sales ≈ $1,968,257.
Skewness: BBLS ≈ 1.35; Sales ≈ 1.22 (both positive, indicating right-skewed
distributions).
Kurtosis: BBLS ≈ 0.81; Sales ≈ 0.35 (both positive, indicates the distributions have
slightly heavier tails than a normal distribution).
Interpretation
Between 2000 and 2012, Ska Brewing Company sold an average of 9,165 barrels of craft beer
annually, with a standard deviation of 7,445, indicating substantial year-to-year growth. The
median sales volume was 6,268 barrels, with no mode, a minimum of 2,595 barrels, and a
maximum of 25,771 barrels. The distribution is positively skewed (1.35), reflecting a
concentration of lower values in early years and rapid increases in later years. The mean (9,165)
lies above the median (6,268), consistent with this skew. A kurtosis of 0.81 suggests a slightly
peaked distribution with heavier tails, highlighting the company’s accelerating production trend
over time.
The company generated an average annual sales revenue of $2,289,489 with a standard deviation
of $1,968,257, reflecting significant growth over the years. The median sales figure was
, $1,481,759, with no mode, a minimum of $521,050, and a maximum of $6,553,145. The
distribution is positively skewed (1.22), indicating most sales occurred in the lower range during
early years, with sharp increases in later years. The mean sales ($2,289,489) exceeds the median
($1,481,759), reinforcing the skew. A kurtosis of 0.35 suggests a slightly peaked distribution with
moderately heavy tails, consistent with the company’s accelerating revenue growth.
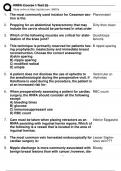
These visuals reinforce the positive skewness and non-normal distribution noted in the
descriptive statistics, with most years falling in the lower range. Only a few years (later in the
timeline) exhibit very high barrel sales, contributing to the long right tail. This indicates that
rapid revenue growth occurred in the later years (2008–2012), while earlier years were clustered
at sales and lower revenue levels.
Part A
Summary: Descriptive Statistics
Mean: BBLS ≈ 9,165 barrels; Sales ≈ $2,289,489.
Median: BBLS = 6,268.8; Sales = $1,481,759.
Mode: None (all values are unique; no repeated value).
Standard Deviation: BBLS ≈ 7,445; Sales ≈ $1,968,257.
Skewness: BBLS ≈ 1.35; Sales ≈ 1.22 (both positive, indicating right-skewed
distributions).
Kurtosis: BBLS ≈ 0.81; Sales ≈ 0.35 (both positive, indicates the distributions have
slightly heavier tails than a normal distribution).
Interpretation
Between 2000 and 2012, Ska Brewing Company sold an average of 9,165 barrels of craft beer
annually, with a standard deviation of 7,445, indicating substantial year-to-year growth. The
median sales volume was 6,268 barrels, with no mode, a minimum of 2,595 barrels, and a
maximum of 25,771 barrels. The distribution is positively skewed (1.35), reflecting a
concentration of lower values in early years and rapid increases in later years. The mean (9,165)
lies above the median (6,268), consistent with this skew. A kurtosis of 0.81 suggests a slightly
peaked distribution with heavier tails, highlighting the company’s accelerating production trend
over time.
The company generated an average annual sales revenue of $2,289,489 with a standard deviation
of $1,968,257, reflecting significant growth over the years. The median sales figure was
, $1,481,759, with no mode, a minimum of $521,050, and a maximum of $6,553,145. The
distribution is positively skewed (1.22), indicating most sales occurred in the lower range during
early years, with sharp increases in later years. The mean sales ($2,289,489) exceeds the median
($1,481,759), reinforcing the skew. A kurtosis of 0.35 suggests a slightly peaked distribution with
moderately heavy tails, consistent with the company’s accelerating revenue growth.
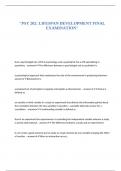
These visuals reinforce the positive skewness and non-normal distribution noted in the
descriptive statistics, with most years falling in the lower range. Only a few years (later in the
timeline) exhibit very high barrel sales, contributing to the long right tail. This indicates that
rapid revenue growth occurred in the later years (2008–2012), while earlier years were clustered
at sales and lower revenue levels.