VAYCAYNATION: DRIVING WEBSITE TRAFFIC THROUGH SECOND-
SCREEN ANALYTICS CASE STUDY SOLUTION
e
pl
SYNOPSIS
m
Sa
In 2018, VacayNation, a German start-up operating an online travel and booking portal, had just received
a long-awaited equity infusion from a private investor. Despite the growth that VaycayNation had been able
to achieve since its launch in 2016, the company still had low brand awareness in the German online travel
n
and booking market. To improve this bottleneck in the conversion funnel, Tom Meier, chief marketing
officer (CMO), wants to launch a major TV advertising campaign aimed at attracting more visitors to the
tio
company’s website. In the past, the company’s marketing campaigns relied on the intuition of the marketing
department. Meier knew this was no longer viable and had just hired Lisa Weber to analyze a previous
campaign and draw conclusions to help design the upcoming one. In particular, Weber needs to analyze
lu
data on VaycayNation’s past TV advertising and website traffic in order to infer how different
characteristics of past TV spot airings helped drive visitors to the company’s website. Besides preparing
So
the data and structuring her analysis, Weber also needs to interpret and present the results in a way that
provides clear guidance to the CMO.
OBJECTIVES
• Engage in quantitative analyses in order to make better-informed marketing decisions (e.g., in TV
advertising).
• Demonstrate the value of data-driven decision-making, especially considering the increasing
availability of data at relatively low costs.
• Understand the possible relationships between traditional media touchpoints (i.e., TV advertising) and
online media touchpoints (i.e., the company’s website) and identify and use such cross-channel linkages
for more effective marketing management.
• Understand linear regression analysis, including its application and interpretation.
The Case Solution Starts From page 7
, e
pl
m
Sa
n
tio
lu
So
ASSIGNMENT QUESTIONS
1. Which of the spots has most contributed to increases in website visits?
2. How important is content (i.e., spots 1–7) in explaining website visits relative to placement and timing
factors? In addition to the variables in the data set, this analysis should also include the day of the week
and whether an ad aired during prime time (i.e., between 8 and 10 p.m., or 20 to 22 h).
3. Which configuration (in terms of content, placement, and timing) is the best to recommend for the
summer campaign? In addition, what lifts in webpage visits and sales can be expected from that
configuration?
The Case Solution Starts From page 7
, e
pl
m
Sa
n
tio
lu
So
1. Which of the spots has most contributed to increases in website visits?
The first question for Weber is to examine which of the spots have contributed most to increases in website
visits. Depending on the students’ qualifications and experience in statistical modelling, the instructor may
first call their attention to the basic relationship between spots and website visits. Further influencing variables
should be accounted for in subsequent steps of the analysis. Through this step-wise approach, students,
especially those who are less familiar with statistical modelling, will experience hands-on what it means to
obtain biased parameter estimates resulting from a misspecified model with important omitted variables.
To underline this approach, the instructor can highlight the corresponding conceptual model on the board,
The Case Solution Starts From page 7
, EXHIBIT TN-4: R-CODE (RECODING OF NOMINAL SPOT VARIABLE)
R-Console
#Recode Spot variable into seven separate dummy variables Spot1-Spot7
dta$Spot1 <- ifelse(dta$Spot == 1, 1,0)
dta$Spot2 <- ifelse(dta$Spot == 2, 1,0)
dta$Spot3 <- ifelse(dta$Spot == 3, 1,0)
dta$Spot4 <- ifelse(dta$Spot == 4, 1,0)
dta$Spot5 <- ifelse(dta$Spot == 5, 1,0)
dta$Spot6 <- ifelse(dta$Spot == 6, 1,0)
dta$Spot7 <- ifelse(dta$Spot == 7, 1,0)
e
EXHIBIT TN-5: R-CODE (CONSTRUCTING DEPENDENT VARIABLE)
pl
m
Sa
n
tio
lu
So
The Case Solution Starts From page 7
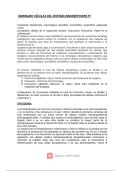
, EXHIBIT TN-12: R-OUTPUT (REGRESSION MODEL 3 WITH SPOT, CHANNEL, AND GENRE
INFORMATION)
R-Console
Coefficients:
Estimate Std. Error t value Pr(>|t|)
(Intercept) 14.663 45.413 0.323 0.74749
Spot1 38.342 19.474 1.969 0.05187 .
Spot2 24.385 20.169 1.209 0.22966
Spot3 12.475 22.926 0.544 0.58762
Spot4 11.422 19.713 0.579 0.56368
Spot5 19.337 19.715 0.981 0.32918
Spot6 48.642 23.383 2.080 0.04020 *
ChannelRTL -34.060 20.065 -1.697 0.09288 .
ChannelVOX 8.661 15.701 0.552 0.58253
e
GenreBasketball 41.425 43.141 0.960 0.33937
Gen
pl
m
Sa
n
tio
lu
So
The Case Solution Starts From page 7
, EXHIBIT TN-16: R-OUTPUT (REGRESSION MODEL 4 WITH SPOT, CHANNEL, GENRE, WEEKDAY,
AND PRIME TIME INFORMATION)
R-Console
Coefficients:
Estimate Std. Error t value Pr(>|t|)
(Intercept) 8.0258 44.9050 0.179 0.85856
Spot1 35.9695 18.4112 1.954 0.05392 .
Spot2 23.5627 19.2175 1.226 0.22343
Spot3 32.0779 21.9110 1.464 0.14675
Spot4 13.8094 18.4769 0.747 0.45682
Spot5 25.5260 18.9170 1.349 0.18068
Spot6 52.9701 22.0931 2.398 0.01862 *
ChannelRTL -54.6999 22.3145 -2.451 0.01621 *
e
pl
m
Sa
n
tio
lu
So
The Case Solution Starts From page 7
SCREEN ANALYTICS CASE STUDY SOLUTION
e
pl
SYNOPSIS
m
Sa
In 2018, VacayNation, a German start-up operating an online travel and booking portal, had just received
a long-awaited equity infusion from a private investor. Despite the growth that VaycayNation had been able
to achieve since its launch in 2016, the company still had low brand awareness in the German online travel
n
and booking market. To improve this bottleneck in the conversion funnel, Tom Meier, chief marketing
officer (CMO), wants to launch a major TV advertising campaign aimed at attracting more visitors to the
tio
company’s website. In the past, the company’s marketing campaigns relied on the intuition of the marketing
department. Meier knew this was no longer viable and had just hired Lisa Weber to analyze a previous
campaign and draw conclusions to help design the upcoming one. In particular, Weber needs to analyze
lu
data on VaycayNation’s past TV advertising and website traffic in order to infer how different
characteristics of past TV spot airings helped drive visitors to the company’s website. Besides preparing
So
the data and structuring her analysis, Weber also needs to interpret and present the results in a way that
provides clear guidance to the CMO.
OBJECTIVES
• Engage in quantitative analyses in order to make better-informed marketing decisions (e.g., in TV
advertising).
• Demonstrate the value of data-driven decision-making, especially considering the increasing
availability of data at relatively low costs.
• Understand the possible relationships between traditional media touchpoints (i.e., TV advertising) and
online media touchpoints (i.e., the company’s website) and identify and use such cross-channel linkages
for more effective marketing management.
• Understand linear regression analysis, including its application and interpretation.
The Case Solution Starts From page 7
, e
pl
m
Sa
n
tio
lu
So
ASSIGNMENT QUESTIONS
1. Which of the spots has most contributed to increases in website visits?
2. How important is content (i.e., spots 1–7) in explaining website visits relative to placement and timing
factors? In addition to the variables in the data set, this analysis should also include the day of the week
and whether an ad aired during prime time (i.e., between 8 and 10 p.m., or 20 to 22 h).
3. Which configuration (in terms of content, placement, and timing) is the best to recommend for the
summer campaign? In addition, what lifts in webpage visits and sales can be expected from that
configuration?
The Case Solution Starts From page 7
, e
pl
m
Sa
n
tio
lu
So
1. Which of the spots has most contributed to increases in website visits?
The first question for Weber is to examine which of the spots have contributed most to increases in website
visits. Depending on the students’ qualifications and experience in statistical modelling, the instructor may
first call their attention to the basic relationship between spots and website visits. Further influencing variables
should be accounted for in subsequent steps of the analysis. Through this step-wise approach, students,
especially those who are less familiar with statistical modelling, will experience hands-on what it means to
obtain biased parameter estimates resulting from a misspecified model with important omitted variables.
To underline this approach, the instructor can highlight the corresponding conceptual model on the board,
The Case Solution Starts From page 7
, EXHIBIT TN-4: R-CODE (RECODING OF NOMINAL SPOT VARIABLE)
R-Console
#Recode Spot variable into seven separate dummy variables Spot1-Spot7
dta$Spot1 <- ifelse(dta$Spot == 1, 1,0)
dta$Spot2 <- ifelse(dta$Spot == 2, 1,0)
dta$Spot3 <- ifelse(dta$Spot == 3, 1,0)
dta$Spot4 <- ifelse(dta$Spot == 4, 1,0)
dta$Spot5 <- ifelse(dta$Spot == 5, 1,0)
dta$Spot6 <- ifelse(dta$Spot == 6, 1,0)
dta$Spot7 <- ifelse(dta$Spot == 7, 1,0)
e
EXHIBIT TN-5: R-CODE (CONSTRUCTING DEPENDENT VARIABLE)
pl
m
Sa
n
tio
lu
So
The Case Solution Starts From page 7
, EXHIBIT TN-12: R-OUTPUT (REGRESSION MODEL 3 WITH SPOT, CHANNEL, AND GENRE
INFORMATION)
R-Console
Coefficients:
Estimate Std. Error t value Pr(>|t|)
(Intercept) 14.663 45.413 0.323 0.74749
Spot1 38.342 19.474 1.969 0.05187 .
Spot2 24.385 20.169 1.209 0.22966
Spot3 12.475 22.926 0.544 0.58762
Spot4 11.422 19.713 0.579 0.56368
Spot5 19.337 19.715 0.981 0.32918
Spot6 48.642 23.383 2.080 0.04020 *
ChannelRTL -34.060 20.065 -1.697 0.09288 .
ChannelVOX 8.661 15.701 0.552 0.58253
e
GenreBasketball 41.425 43.141 0.960 0.33937
Gen
pl
m
Sa
n
tio
lu
So
The Case Solution Starts From page 7
, EXHIBIT TN-16: R-OUTPUT (REGRESSION MODEL 4 WITH SPOT, CHANNEL, GENRE, WEEKDAY,
AND PRIME TIME INFORMATION)
R-Console
Coefficients:
Estimate Std. Error t value Pr(>|t|)
(Intercept) 8.0258 44.9050 0.179 0.85856
Spot1 35.9695 18.4112 1.954 0.05392 .
Spot2 23.5627 19.2175 1.226 0.22343
Spot3 32.0779 21.9110 1.464 0.14675
Spot4 13.8094 18.4769 0.747 0.45682
Spot5 25.5260 18.9170 1.349 0.18068
Spot6 52.9701 22.0931 2.398 0.01862 *
ChannelRTL -54.6999 22.3145 -2.451 0.01621 *
e
pl
m
Sa
n
tio
lu
So
The Case Solution Starts From page 7