,Contents
Part I Introductory Chapters 4 Statistics for Food Analysis . . . . . 49
Andrew P. Neilson
1 Laboratory Standard Operating 4.1 Introduction . . . . . . . . . . . . . . . 49
Procedures . . . . . . . . . . . . . . . . . . . 3 4.2 Population Distributions . . . . . 50
Andrew P. Neilson 4.3 Z-Scores . . . . . . . . . . . . . . . . . 52
1.1 Introduction . . . . . . . . . . . . . . . 4 4.4 Sample Distributions . . . . . . . . 54
1.2 Precision and Accuracy . . . . . . 4 4.5 Confidence Intervals . . . . . . . . 56
1.3 Balances . . . . . . . . . . . . . . . . . 5 4.6 t-Scores . . . . . . . . . . . . . . . . . . 58
1.4 Mechanical Pipettes . . . . . . . . 7 4.7 t-Tests . . . . . . . . . . . . . . . . . . . 60
1.5 Glassware . . . . . . . . . . . . . . . . 8 4.8 Practical Considerations . . . . . 62
1.6 Reagents . . . . . . . . . . . . . . . . . 15 4.9 Practice Problems . . . . . . . . . . 62
1.7 Data Handling and 4.10 Terms and Symbols . . . . . . . . . 63
Reporting. . . . . . . . . . . . . . . . . 17
1.8 Basic Laboratory Safety . . . . . 18 Part II Laboratory Exercises
Resource Materials . . . . . . . . . . . . . 19
5 Nutrition Labeling Using a
2 Reagents and Buffers . . . . . . . . . . 21
Computer Software Program . . . 67
Catrin Tyl and B. Pam Ismail
Ann M. Roland
2.1 Reagents of Specified
5.1 Introduction . . . . . . . . . . . . . . . 67
Concentrations . . . . . . . . . . . . 21
5.2 Preparing Nutrition Labels for
2.2 Use of Titration to Determine
Sample Yogurt Formulas . . . . . 68
Concentration of Analytes. . . . 24
5.3 Adding New Ingredients to
2.3 Buffers. . . . . . . . . . . . . . . . . . . 25
a Formula and Determining
2.4 Notes on Buffers . . . . . . . . . . . 30
How They Influence the
2.5 Practice Problems . . . . . . . . . . 30
Nutrition Label . . . . . . . . . . . . 70
References . . . . . . . . . . . . . . . . . . . . 31
5.4 An Example of Reverse
3 Dilutions and Concentrations . . . 33 Engineering in Product
Andrew P. Neilson Development . . . . . . . . . . . . . . 72
3.1 Introduction . . . . . . . . . . . . . . . 33 5.5 Questions. . . . . . . . . . . . . . . . . 72
3.2 Reasons for Dilutions and Resource Materials . . . . . . . . . . . . . 72
Concentrations . . . . . . . . . . . . 34
6 Accuracy and Precision
3.3 Using Volumetric Glassware
Assessment . . . . . . . . . . . . . . . . . . . 73
to Perform Dilutions and
S. Suzanne Nielsen
Concentrations . . . . . . . . . . . . 34
6.1 Introduction . . . . . . . . . . . . . . . 73
3.4 Calculations for Dilutions
6.2 Procedure . . . . . . . . . . . . . . . . 75
and Concentrations . . . . . . . . . 34
6.3 Data and Calculations . . . . . . . 75
3.5 Special Cases . . . . . . . . . . . . . 40
6.4 Questions. . . . . . . . . . . . . . . . . 76
3.6 Standard Curves . . . . . . . . . . . 42
Resource Materials . . . . . . . . . . . . . 76
3.7 Unit Conversions. . . . . . . . . . . 45
3.8 Avoiding Common Errors . . . . 45
3.9 Practice Problems . . . . . . . . . . 47
ix
,x Contents
7 Preparation of Solutions and 11.4 Questions . . . . . . . . . . . . . . . 108
Buffers . . . . . . . . . . . . . . . . . . . . . . 77 Resource Materials . . . . . . . . . . . . . 109
B. Pam Ismail
12 Mid-Infrared Spectroscopy
7.1 Introduction . . . . . . . . . . . . . . . 78
Analysis . . . . . . . . . . . . . . . . . . . . . 111
7.2 Preparation of Hydrochloric
Luis Rodriguez-Saona, Siyu Yao,
Acid Solution . . . . . . . . . . . . . 78
and Shreya Madhav Nuguri
7.3 Preparation of Saturated
12.1 Introduction . . . . . . . . . . . . . 111
Sodium Chloride Solution. . . . 79
12.2 Determination of Trans-Fat
7.4 Preparation of Caffeine
Content in Butter and
Standards . . . . . . . . . . . . . . . . . 79
Margarine by Mid-Infrared
7.5 Preparation of a Buffering
Spectroscopy . . . . . . . . . . . . 112
Solution . . . . . . . . . . . . . . . . . . 81
12.3 Questions . . . . . . . . . . . . . . . 118
7.6 Questions. . . . . . . . . . . . . . . . . 82
References . . . . . . . . . . . . . . . . . . . . 118
Resource Material . . . . . . . . . . . . . . 82
13 Moisture Content
8 High-Performance Liquid
Determination . . . . . . . . . . . . . . . . 119
Chromatography . . . . . . . . . . . . . . 83
B. Pam Ismail and
B. Pam Ismail
S. Suzanne Nielsen
and S. Suzanne Nielsen
13.1 Introduction . . . . . . . . . . . . . 120
8.1 Introduction . . . . . . . . . . . . . . . 83
13.2 Forced Draft Oven . . . . . . . . 120
8.2 Determination of Caffeine
13.3 Vacuum Oven . . . . . . . . . . . . 122
in Beverages by HPLC . . . . . . 84
13.4 Microwave Drying Oven . . . 123
Resource Materials . . . . . . . . . . . . . 87
13.5 Rapid Moisture Analyzer . . . 123
9 Gas Chromatography . . . . . . . . . . 89 13.6 Karl Fischer Method . . . . . . 124
B. Pam Ismail and 13.7 Near-Infrared Analyzer . . . . 126
S. Suzanne Nielsen 13.8 Questions . . . . . . . . . . . . . . . 127
9.1 Introduction . . . . . . . . . . . . . . . 89 Resource Materials . . . . . . . . . . . . . 127
9.2 Preparation of Fatty Acid
14 Ash Content Determination . . . . . 129
Methyl Esters (Fames), and
B. Pam Ismail
Determination of Fatty Acid
14.1 Introduction . . . . . . . . . . . . . 129
Profile of Oils by Gas
14.2 Procedure . . . . . . . . . . . . . . . 130
Chromatography . . . . . . . . . . . 90
14.3 Data and Calculations . . . . . 131
Resource Materials . . . . . . . . . . . . . 93
14.4 Questions . . . . . . . . . . . . . . . 131
10 Mass Spectrometry with Resources . . . . . . . . . . . . . . . . . . . . 131
High-Performance Liquid
15 Fat Content Determination . . . . . 133
Chromatography . . . . . . . . . . . . . . 95
B. Pam Ismail and
B. Pam Ismail
S. Suzanne Nielsen
10.1 Introduction . . . . . . . . . . . . . 95
15.1 Introduction . . . . . . . . . . . . . 134
10.2 Procedure . . . . . . . . . . . . . . . 98
15.2 Soxhlet Method . . . . . . . . . . 135
10.3 Data and Calculations . . . . . 99
15.3 Goldfisch Method. . . . . . . . . 136
10.4 Questions . . . . . . . . . . . . . . . 100
15.4 Mojonnier Method . . . . . . . . 137
10.5 Case Study . . . . . . . . . . . . . . 100
15.5 Babcock Method . . . . . . . . . 139
Resource Materials . . . . . . . . . . . . . 102
Resource Materials . . . . . . . . . . . . . 140
11 Determination of Minerals on
16 Protein Nitrogen
Nutrition Label by Atomic
Determination . . . . . . . . . . . . . . . . 141
Absorption Spectroscopy . . . . . . . 103
B. Pam Ismail and
B. Pam Ismail and
S. Suzanne Nielsen
S. Suzanne Nielsen
16.1 Introduction . . . . . . . . . . . . . 141
11.1 Introduction . . . . . . . . . . . . . 103
16.2 Kjeldahl Nitrogen
11.2 Procedure . . . . . . . . . . . . . . . 105
Method . . . . . . . . . . . . . . . . . 142
11.3 Data and Calculations . . . . . 106
,Contents xi
16.3 Nitrogen Combustion 22 Standard Solutions and
Method . . . . . . . . . . . . . . . . . 145 Titratable Acidity . . . . . . . . . . . . . 177
Resource Materials . . . . . . . . . . . . . 146 S. Suzanne Nielsen
22.1 Introduction . . . . . . . . . . . . . 177
17 Total Carbohydrate by
22.2 Preparation and
Phenol-Sulfuric Acid Method. . . . 147
Standardization of Base
S. Suzanne Nielsen
and Acid Solutions . . . . . . . . 178
17.1 Introduction . . . . . . . . . . . . . 147
22.3 Titratable Acidity and pH . . . 180
17.2 Procedure . . . . . . . . . . . . . . . 148
Resource Materials . . . . . . . . . . . . . 182
17.3 Data and Calculations . . . . . 149
17.4 Questions . . . . . . . . . . . . . . . 150 23 Fat Characterization . . . . . . . . . . . 183
Resource Materials . . . . . . . . . . . . . 151 S. Suzanne Nielsen
23.1 Introduction . . . . . . . . . . . . . 184
18 Vitamin C Determination by
23.2 Saponification Value. . . . . . . 184
Indophenol Method. . . . . . . . . . . . 153
23.3 Iodine Value . . . . . . . . . . . . . 186
S. Suzanne Nielsen
23.4 Free Fatty Acid Value . . . . . . 187
18.1 Introduction . . . . . . . . . . . . . 153
23.5 Peroxide Value . . . . . . . . . . . 189
18.2 Procedure . . . . . . . . . . . . . . . 155
23.6 Thin-Layer Chromatography
18.3 Data and Calculations . . . . . 155
Separation of Simple
18.4 Questions . . . . . . . . . . . . . . . 156
Lipids . . . . . . . . . . . . . . . . . . 190
Resource Materials . . . . . . . . . . . . . 156
Resource Materials . . . . . . . . . . . . . 192
19 Water Hardness Testing by
24 Proteins: Extraction, Quantitation,
Complexometric Determination
and Electrophoresis. . . . . . . . . . . . 193
of Calcium . . . . . . . . . . . . . . . . . . . 157
S. Suzanne Nielsen and
S. Suzanne Nielsen
Denise M. Smith
19.1 Introduction . . . . . . . . . . . . . 157
24.1 Introduction . . . . . . . . . . . . . 193
19.2 EDTA Titrimetric Method
24.2 Reagents . . . . . . . . . . . . . . . . 195
for Testing Hardness of
24.3 Supplies . . . . . . . . . . . . . . . . 196
Water . . . . . . . . . . . . . . . . . . 158
24.4 Equipment . . . . . . . . . . . . . . 196
19.3 Test Strips for Water
24.5 Procedure . . . . . . . . . . . . . . . 196
Hardness. . . . . . . . . . . . . . . . 160
24.6 Data and Calculations . . . . . 198
Resource Materials . . . . . . . . . . . . . 161
24.7 Questions . . . . . . . . . . . . . . . 199
20 Phosphorus Determination by Resource Materials . . . . . . . . . . . . . 199
Murphy-Riley Method . . . . . . . . . 163
25 Glucose Determination by
Young-Hee Cho and
Enzyme Analysis . . . . . . . . . . . . . . 201
S. Suzanne Nielsen
B. Pam Ismail and
20.1 Introduction . . . . . . . . . . . . . 163
Robert E. Ward
20.2 Procedure . . . . . . . . . . . . . . . 164
25.1 Introduction . . . . . . . . . . . . . 201
20.3 Data and Calculations . . . . . 165
25.2 Procedure . . . . . . . . . . . . . . . 202
20.4 Questions . . . . . . . . . . . . . . . 165
25.3 Data and Calculations . . . . . 203
Resource Materials . . . . . . . . . . . . . 165
25.4 Questions . . . . . . . . . . . . . . . 203
21 Sodium Determination Using Resource Materials . . . . . . . . . . . . . 203
Ion-Selective Electrodes, Mohr
26 Gliadin Detection by
Titration, and Test Strips . . . . . . . 167
Immunoassay . . . . . . . . . . . . . . . . . 205
S. Suzanne Nielsen
Qinchun Rao
21.1 Introduction . . . . . . . . . . . . . 168
26.1 Introduction . . . . . . . . . . . . . 205
21.2 Ion-Selective Electrodes . . . 168
26.2 Procedure . . . . . . . . . . . . . . . 207
21.3 Mohr Titration . . . . . . . . . . . 170
26.3 Data and Calculations . . . . . 208
21.4 Quantab® Test Strips . . . . . . 172
26.4 Questions . . . . . . . . . . . . . . . 208
21.5 Summary of Results . . . . . . . 174
Resource Materials . . . . . . . . . . . . . 209
21.6 Questions . . . . . . . . . . . . . . . 174
Resource Materials . . . . . . . . . . . . . 175
,xii Contents
27 Rheological Measurements 29.5 Extraneous Matter in
of Food Products . . . . . . . . . . . . . . 211 Potato Chips . . . . . . . . . . . . . 229
Helen S. Joyner 29.6 Extraneous Matter in
27.1 Introduction . . . . . . . . . . . . . 211 Citrus Juice. . . . . . . . . . . . . . 229
27.2 Viscosity Measurement by 29.7 Questions . . . . . . . . . . . . . . . 230
Brookfield Viscometer . . . . . 212 Resource Materials . . . . . . . . . . . . . 230
27.3 Viscosity Measurement by
30 Food Forensics . . . . . . . . . . . . . . . . 231
Bostwick Consistometer . . . 213
Jinping Dong
27.4 Large-Strain Compression
30.1 Introduction . . . . . . . . . . . . . 231
Measurement . . . . . . . . . . . . 214
30.2 Assessing Foreign
27.5 Questions . . . . . . . . . . . . . . . 216
Materials in a Powdered
Resource Materials . . . . . . . . . . . . . 217
Food Product . . . . . . . . . . . . 232
28 Color Measurements of a 30.3 Forensics Report . . . . . . . . . 234
Solid and Calculation of 30.4 Questions . . . . . . . . . . . . . . . 234
Color Specifications from Resource Materials . . . . . . . . . . . . . 234
Spectral Data . . . . . . . . . . . . . . . . . 219
M. Monica Giusti, Part III Answers to Practice Problems
Danielle M. Voss, and
Gonzalo Miyagusuku-Cruzado 31 Answers to Practice Problems
28.1 Introduction . . . . . . . . . . . . . 219 in Chapter 2, Preparation of
28.2 Procedure . . . . . . . . . . . . . . . 220 Reagents and Buffers . . . . . . . . . . 237
28.3 Questions . . . . . . . . . . . . . . . 223 Catrin Tyl and B. Pam Ismail
Resource Materials . . . . . . . . . . . . . 223
32 Answers to Practice Problems in
29 Extraneous Matter Chapter 3, Dilutions and
Examination. . . . . . . . . . . . . . . . . . 225 Concentrations . . . . . . . . . . . . . . . 243
S. Suzanne Nielsen Andrew P. Neilson
29.1 Introduction . . . . . . . . . . . . . 226
33 Answers to Practice Problems in
29.2 Extraneous Matter in
Chapter 4, Use of Statistics in
Soft Cheese . . . . . . . . . . . . . 227
Food Analysis . . . . . . . . . . . . . . . . . 249
29.3 Extraneous Matter in Jam . . 227
Andrew P. Neilson
29.4 Extraneous Matter in
Infant Food . . . . . . . . . . . . . . 228
, Laboratory Standard Operating
Procedures 1
Andrew P. Neilson
Contents
1.1 Introduction 4
1.2 Precision and Accuracy 4
1.3 Balances 5
1.3.1 Types of Balances 5
1.3.2 Choice of Balance 5
1.3.3 Use of Top Loading Balances 6
1.3.4 Use of Analytical Balances 6
1.3.5 Additional Information 6
1.4 Mechanical Pipettes 7
1.4.1 Operation 7
1.4.2 Pre-Rinsing 7
1.4.3 Pipetting Solutions of Varying Density or Viscosity 8
1.4.4 Performance Specifications 8
1.4.5 Selecting the Correct Pipette 8
1.5 Glassware 8
1.5.1 Types of Glassware/Plasticware 8
1.5.2 Choosing Glassware/Plasticware 9
1.5.3 Volumetric Glassware 9
1.5.4 Using Volumetric Glassware to Perform Dilutions and Concentrations 10
1.5.5 Conventions and Terminology 13
1.5.6 Burets 14
1.5.7 Cleaning of Glass and Porcelain 15
1.6 Reagents 15
1.6.1 Acids 15
1.6.2 Distilled Water 15
1.6.3 Water Purity 16
1.6.4 Carbon-Dioxide-Free Water 16
1.6.5 Preparing Solutions and Reagents 16
1.7 Data Handling and Reporting 17
1.7.1 Significant Figures 17
1.7.2 Rounding Off Numbers 17
1.7.3 Rounding Off Single Arithmetic Operations 17
1.7.4 Rounding Off the Results of a Series of Arithmetic Operations 18
1.8 Basic Laboratory Safety 18
1.8.1 Safety Data Sheets 18
1.8.2 Hazardous Chemicals 18
A. P. Neilson (*)
Department of Food, Bioprocessing and Nutrition Sciences, North
Carolina State University, Raleigh, NC, USA
e-mail:
© The Author(s), under exclusive license to Springer Nature Switzerland AG 2024 3
B. P. Ismail, S. S. Nielsen (eds.), Nielsen’s Food Analysis Laboratory Manual, Food Science Text Series,
https://doi.org/10.1007/978-3-031-44970-3_1
,4 A. P. Neilson
1.8.3 Personal Protective Equipment and Safety Equipment 18
1.8.4 Eating, Drinking, Etc. 19
1.8.5 Miscellaneous Information 19
Resource Materials 19
1.1 INTRODUCTION sion of precision and accuracy. The smaller these values are,
the more reproducible or precise the measurement is.
This chapter is designed to cover essential “standard operat- Precision is determined not on reference standards, but by
ing procedures” (SOPs), or best practices, for a general food the use of actual food samples, which cover a range of con-
analysis laboratory. The topics covered in this chapter centrations and a variety of interfering materials usually
include balances, mechanical pipettes, glassware, reagents, encountered by the analyst. Obviously, such data should not
precision and accuracy, data handling, data reporting, and be collected until the analyst is familiar with the method and
safety. These procedures apply to all the laboratory experi- has obtained a reproducible standard curve (a mathematical
ments in this manual, and therefore a thorough review of relationship between the analyte concentration and the ana-
general procedures will be invaluable for successful comple- lytical response). There are a number of different methods
tion of these laboratory exercises as well as development of available for the determination of precision. One method
sound laboratory skills. follows:
This manual covers many of the basic skills and informa-
tion that are necessary for one to be a good analytical food 1. Three separate concentration levels should be studied,
chemist. Much of this material is the type that one typically including a low concentration near the sensitivity level of
“picks up” from experience over time working in a labora- the method, an intermediate concentration, and a concen-
tory. Nothing can replace actual lab experience as a learning tration near the upper limit of application of the method.
tool, but hopefully this manual will help students learn 2. Seven replicate determinations should be made at each of
proper lab techniques early rather than having to correct the concentrations tested.
improper habits later. When one reads this manual, your 3. To allow for changes in instrument conditions, the preci-
reaction may be “is all of this attention to detail necessary?” sion study should cover at least 2 hours of normal labora-
Admittedly, the answer is “not always.” This brings to mind tory operation.
an old Irish proverb that “the best person for a job is the one 4. To permit the maximum interferences in sequential oper-
that knows what to ignore.” There is much truth to this prov- ation, it is suggested that the samples be run in the follow-
erb, but a necessary corollary is that one must know what ing order: high, low, and intermediate. This series is then
they are ignoring. The decision to use something other than repeated seven times to obtain the desired replication.
the “best” technique must be conscious decision and not one 5. The precision statement should include a range of stan-
made from ignorance. This decision must be based not only dard deviations over the tested range of concentration.
upon knowledge of the analytical method being used but also Thus, three standard deviations will be obtained over a
on how the resulting data will be used. Much of the informa- range of three concentrations.
tion in this manual has been obtained from an excellent pub-
lication by the US Environmental Protection Agency entitled Accuracy refers to the degree (absolute or relative) of dif-
Handbook for Analytical Quality Control in Water and ference between observed and “actual” or “true” values. The
Wastewater Laboratories. “actual” value is often difficult to ascertain or unknown. It
may be the value obtained by a standard reference method
(the accepted manner of performing a measurement).
1.2 PRECISION AND ACCURACY Another means of evaluating accuracy is by the addition of a
known amount of the material being analyzed for the food
To understand many of the concepts in this chapter, rigorous sample and then calculation of % recovery. This latter
definition of the terms “precision” and “accuracy” is required approach entails the following steps:
here. These terms are often used incorrectly, or are used
interchangeably (also incorrect). Precision refers to the 1. Known amounts of the particular constituent are added to
reproducibility of replicate observations, typically mea- actual samples at concentrations for which the precision
sured as standard deviation (SD), standard error (SE), or of the method is satisfactory. It is suggested that amounts
coefficient of variation (CV). Refer to Chap. 4 in this labo- be added to the low-concentration sample, sufficient to
ratory manual and Smith (2024) for a more complete discus- double that concentration, and that an amount be added to
,1 Laboratory Standard Operating Procedures 5
the intermediate concentration, sufficient to bring the 1.3 BALANCES
final concentration in the sample to approximately 75%
of the upper limit of application of the method. 1.3.1 Types of Balances
2. Seven replicate determinations at each concentration are
made. Balances quantify mass, or amount of matter (commonly
3. Accuracy is reported as the percent recovery at the final referred to as “weight,” although weight is technically a
concentration of the spiked sample. Percent recovery at function of mass and the force of gravity). This is a key
each concentration is the mean of the seven replicate measurement for analytical chemistry, particularly quanti-
results. tative methods. Two general types of balances are used in
most laboratories. These are top loading balances and
A fast, less rigorous means to evaluate precision and analytical balances. Top loading balances usually are sen-
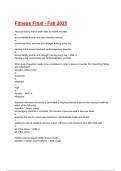
accuracy is to analyze a food sample and replicate a spiked sitive to 0.1–0.001 g, depending on the specific model in
food sample, and then calculate the recovery of the amount use (this means that they can measure differences in the
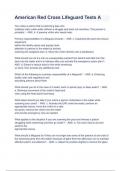
spiked. An example is shown in Table 1.1. mass of a sample to within 0.1–0.001 g). In, general, as the
The accuracy can then be measured by calculating the % capacity (largest mass that can be measured) increases, the
of the spike (0.75 g/L) detected by comparing the measured sensitivity decreases. In other words, balances that can
values from the unspiked and spiked samples: measure larger masses generally measure differences in
those masses to fewer decimal places. Analytical balances
accuracy ≈ % recovery = are usually sensitive to 0.001–0.00001 g, depending on the
measured spiked sample specific model. It should be remembered, however, that
×100%
measured sample + amount of spike (1.1) sensitivity (ability to detect small differences in mass) is
not necessarily equal to accuracy (the degree to which the
accuracy ≈ % recovery = balances correctly report the actual mass). The fact that a
2.0955g / L balance can be read to 0.01 mg does not necessarily mean
× 100% = 102.44% it is accurate to 0.01 mg. What this means is that the bal-
1.2955g / L + 0.75g / L
ance can distinguish between masses that differ by 0.01 mg,
The method measured the spike to within 2.44%. By add- but may not accurately measure those masses to within
ing 0.75 g/L Ca to a sample that was measured to have 0.01 mg of the actual masses (because the last digit is often
1.2955 g/L Ca, a perfectly accurate method would result in a rounded). The accuracy of a balance is independent of its
spiked sample concentration of: sensitivity.
1.2955 g/L + 0.75 g/L = 2.0455 g/L.
The method actually measured the spiked sample at 1.3.2 Choice of Balance
2.0955 g/L, which is 2.44% greater than it should be.
Therefore, the accuracy is estimated at ~2.44% relative error. Which type of balance to use depends on “how much accu-
racy” is needed in a given measurement. One way to deter-
mine this is by calculating how much relative (%) error
Table 1.1 Measured calcium content (g/L) of milk and spiked milk
would be introduced by a given type of balance. For instance,
Replicate Milk Milk + 0.75 g Ca/L
if 0.1 g of a reagent was needed, weighing it on a top loading
1 1.29 2.15
balance accurate to within only ±0.02 g of the actual mass
2 1.40 2.12
3 1.33 2.20
would introduce approximately 20% error:
4 1.24 2.27 % error in measured mass
5 1.23 2.07 absolute error in measured mass
6 1.40 2.10 = ×100%
measured mass (1.2)
7 1.24 2.20
8 1.27 2.07
9 1.24 1.74 0.02 g
% error in measured mass = × 100% = 20%
10 1.28 2.01 0.1g
11 1.33 2.12
Mean 1.2955 2.0955 This would clearly be unacceptable in most situations.
SD 0.062 0.138 Therefore, a more accurate balance would be needed.
%CV 4.8 6.6 However, the same balance (with accuracy to within
,6 A. P. Neilson
±0.02 g) would probably be acceptable for weighing out operation of an analytical balance. If it has been a while
100 g of reagent, as the error would be approximately since you have used a specific type of analytical balance, it
0.02%: may be helpful to “practice” before actually weighing a
sample by weighing a spatula or other convenient article.
0.02 g The following general rules apply to most analytical bal-
% error in measured mass = × 100% = 0.02%
100 g ances and should be followed to ensure that accurate results
are obtained and that the balance is not damaged by
The decision on “how much accuracy” is needed can only
improper use:
be answered when one knows the function of the reagent in
the analytical method. This is one reason why it is necessary
1. Analytical balances are expensive precision instruments;
to understand the principles involved in an analytical method,
treat them as such.
and not to simply approach an analytical method in a cook-
2. Make sure that the balance is level and is on a sturdy table
book fashion. Therefore, a general guideline regarding which
or bench free of vibrations.
balance to use is hard to define.
3. Once these conditions are met, the same procedure speci-
Another situation in which care must be exercised in
fied above for top loading balances is used to weigh the
determining what type of balance to use is when a difference
sample on an analytical balance.
in masses is to be calculated. For instance, a dried crucible to
4. Always leave the balance clean.
be used in a total ash determination may weigh 20.05 g on a
top loading balance, crucible plus sample = 25.05 g, and the
ashed crucible 20.25 g. It may appear that the use of the top
loading balance with its accuracy of ±0.02 g would introduce 1.3.5 Additional Information
approximately 0.1% error, which would often be acceptable.
Actually, since a difference in weight (0.20 g) is being deter- Other points to be aware of regarding the use of balances are
mined, the error would be approximately 10% and thus unac- the following:
ceptable. In this case, an analytical balance is definitely
required because sensitivity is required in addition to 1. Many analyses (moisture, ash, etc.) require weighing of
accuracy. the final dried or ashed sample with the vessel in which
the sample was dried or ashed. The mass of the vessel
must be known so that it can be subtracted from the final
1.3.3 Use of Top Loading Balances mass to get the mass of the dried sample or ash. Therefore,
make sure to obtain the mass of the vessel before the anal-
These instructions are generalized but apply to use of most ysis. This can be done by either weighing the vessel
models of top loading balances: before taring the balance and then adding the sample or
obtaining the mass of the vessel and then the mass of the
1. Level the balance using the bubble level and the adjust- vessel plus the sample.
able feet (leveling is required so that the balance performs 2. The accumulation of moisture from the air or fingerprints
correctly). on the surface of a vessel will add a small mass to the
2. Either zero the balance (so the balance reads 0 with noth- sample. This can introduce errors in mass that affect ana-
ing on the pan) or tare the balance so that the balance lytical results, particularly when using analytical bal-
reads 0 with a container that will hold the sample (empty ances. Therefore, beakers, weigh boats, and other
beaker, weighing boat, etc.) on the weighing pan. The tare weighing vessels should be handled with tongs or with
function is conveniently used for “subtracting” the weight gloved hands. For precise measurements (moisture, ash,
of the beaker or weighing boat into which the sample is and other measurements), weighing vessels should be
added. pre-dried and stored in a desiccator before use, and then
3. Weigh the sample. stored in a desiccator after drying, ashing, etc., prior to
weighing the cooled sample.
3. Air currents or leaning on the bench can cause apprecia-
1.3.4 Use of Analytical Balances ble error in analytical balances. It is best to take the read-
ing after closing the side doors of an analytical balance.
It is always wise to consult the specific instruction manual 4. Most balances in modern laboratories are electric bal-
for an analytical balance before using it. Speed and accu- ances. Older lever-type balances are no longer in wide
racy are both dependent on one being familiar with the use, but they are extremely reliable.
, 1 Laboratory Standard Operating Procedures 7
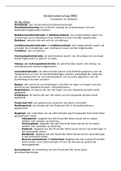
1.4 MECHANICAL PIPETTES Table 1.3 Appropriate dispense wait time for automatic pipettors
Pipette Time (s)
Mechanical pipettes (i.e., automatic pipettors) are stan- P-20D, P-100D, P-200D 1
dard equipment in most analytical laboratories. This is due P-500D, P-1000D 1–2
to their convenience, precision, and acceptable accuracy P-5000D 2–3
when used properly, and when calibrated. Although these
pipettes are often viewed as being easier to use than conven- 5. Allow the plunger to slowly return to the “up” position.
tional glass volumetric pipettes, this does not mean that the Never permit it to snap up (this will suck liquid up into
necessary accuracy and precision can be obtained without the pipette mechanism, causing inaccurate measurement
attention to proper pipetting technique. Just the opposite is and damaging the pipette).
the case; if mechanical pipettes are used incorrectly, this 6. Wait 1–2 s to ensure that full volume of sample is drawn
will usually cause greater error than the misuse of glass into tip. If the solution is viscous such as glycerol, you
volumetric pipettes. Improper pipetting technique is wide- need to allow more time.
spread and contributes significant error to analytical mea- 7. Withdraw tip from sample liquid. Should any liquid
surements. The proper use of glass volumetric pipettes is remain on outside of tip, wipe carefully with a lint-free
discussed in the section on glassware. The pipetman cloth, taking care not to touch the tip opening.
mechanical pipette (Gilson Inc.) is an example of a continu- 8. To dispense sample, place tip end against side wall of
ously adjustable design. The proper use of this type of vessel and depress plunger slowly past the first stop until
pipette, as recommended by the manufacturer, will be the second stop (fully depressed position) is reached.
described here. Other brands of mechanical pipettes are 9. Wait (Table 1.3).
available, and although their specific instructions should be 10. With plunger fully depressed, withdraw mechanical
followed, their proper operation is usually very similar to pipette from the vessel carefully with tip sliding along
that described here. wall of vessel.
11. Allow plunger to return to top position.
12. Discard tip by depressing tip-ejector button smartly.
1.4.1 Operation 13. A fresh tip should be used for the next measurement if:
(a) A different solution or volume is to be pipetted.
1. Set the desired volume on the digital micrometer/volu- (b) A significant residue exists in the tip (not to be con-
meter. For improved precision, always approach the fused with the visible “film” left by some viscous or
desired volume by dialing downward from a larger vol- organic solutions).
ume setting. Make sure not to wind it up beyond its max-
imum capacity; this will break it beyond repair.
2. Attach a disposable tip to the shaft of the pipette and 1.4.2 Pre-Rinsing
press on firmly with a slight twisting motion to ensure a
positive, airtight seal. Pipetting very viscous solutions or organic solvents will
3. Depress the plunger to the first positive stop. This part result in a significant film being retained on the inside wall
of the stroke is the calibrated volume displayed. Going of the tip. This will result in an error that will be larger than
past the first positive stop will cause inaccurate the tolerance specified if the tip is only filled once. Since
measurement. this film remains relatively constant in successive pipet-
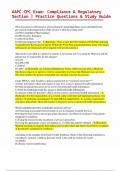
4. Holding the mechanical pipette vertically, immerse the tings with the same tip, accuracy may be improved by fill-
disposable tip into sample liquid to a depth indicated ing the tip, dispensing the volume into a waste container,
(Table 1.2), specific to the maximum volume of the refilling the tip a second time, and using this quantity as the
pipette (P-20, 100, 200, 500, 1000, and 5000, which cor- sample. This procedure is recommended in all pipetting
respond to maximum volumes of 20, 100, 200, 500, operations when critical reproducibility is required,
1000, and 5000 μL, respectively). whether or not tips are reused (same solution) or changed
(different solutions/different volumes). Note that the “non-
Table 1.2 Appropriate pipette depth for automatic pipettors wettability” of the polypropylene tip is not absolute and
Pipette Depth (mm) that pre-rinsing will improve the precision and accuracy
P-20D, P-100D, P-200D 1–2 when pipetting any solution.
P-500D, P-1000D 2–4
P-5000D 3–6
Part I Introductory Chapters 4 Statistics for Food Analysis . . . . . 49
Andrew P. Neilson
1 Laboratory Standard Operating 4.1 Introduction . . . . . . . . . . . . . . . 49
Procedures . . . . . . . . . . . . . . . . . . . 3 4.2 Population Distributions . . . . . 50
Andrew P. Neilson 4.3 Z-Scores . . . . . . . . . . . . . . . . . 52
1.1 Introduction . . . . . . . . . . . . . . . 4 4.4 Sample Distributions . . . . . . . . 54
1.2 Precision and Accuracy . . . . . . 4 4.5 Confidence Intervals . . . . . . . . 56
1.3 Balances . . . . . . . . . . . . . . . . . 5 4.6 t-Scores . . . . . . . . . . . . . . . . . . 58
1.4 Mechanical Pipettes . . . . . . . . 7 4.7 t-Tests . . . . . . . . . . . . . . . . . . . 60
1.5 Glassware . . . . . . . . . . . . . . . . 8 4.8 Practical Considerations . . . . . 62
1.6 Reagents . . . . . . . . . . . . . . . . . 15 4.9 Practice Problems . . . . . . . . . . 62
1.7 Data Handling and 4.10 Terms and Symbols . . . . . . . . . 63
Reporting. . . . . . . . . . . . . . . . . 17
1.8 Basic Laboratory Safety . . . . . 18 Part II Laboratory Exercises
Resource Materials . . . . . . . . . . . . . 19
5 Nutrition Labeling Using a
2 Reagents and Buffers . . . . . . . . . . 21
Computer Software Program . . . 67
Catrin Tyl and B. Pam Ismail
Ann M. Roland
2.1 Reagents of Specified
5.1 Introduction . . . . . . . . . . . . . . . 67
Concentrations . . . . . . . . . . . . 21
5.2 Preparing Nutrition Labels for
2.2 Use of Titration to Determine
Sample Yogurt Formulas . . . . . 68
Concentration of Analytes. . . . 24
5.3 Adding New Ingredients to
2.3 Buffers. . . . . . . . . . . . . . . . . . . 25
a Formula and Determining
2.4 Notes on Buffers . . . . . . . . . . . 30
How They Influence the
2.5 Practice Problems . . . . . . . . . . 30
Nutrition Label . . . . . . . . . . . . 70
References . . . . . . . . . . . . . . . . . . . . 31
5.4 An Example of Reverse
3 Dilutions and Concentrations . . . 33 Engineering in Product
Andrew P. Neilson Development . . . . . . . . . . . . . . 72
3.1 Introduction . . . . . . . . . . . . . . . 33 5.5 Questions. . . . . . . . . . . . . . . . . 72
3.2 Reasons for Dilutions and Resource Materials . . . . . . . . . . . . . 72
Concentrations . . . . . . . . . . . . 34
6 Accuracy and Precision
3.3 Using Volumetric Glassware
Assessment . . . . . . . . . . . . . . . . . . . 73
to Perform Dilutions and
S. Suzanne Nielsen
Concentrations . . . . . . . . . . . . 34
6.1 Introduction . . . . . . . . . . . . . . . 73
3.4 Calculations for Dilutions
6.2 Procedure . . . . . . . . . . . . . . . . 75
and Concentrations . . . . . . . . . 34
6.3 Data and Calculations . . . . . . . 75
3.5 Special Cases . . . . . . . . . . . . . 40
6.4 Questions. . . . . . . . . . . . . . . . . 76
3.6 Standard Curves . . . . . . . . . . . 42
Resource Materials . . . . . . . . . . . . . 76
3.7 Unit Conversions. . . . . . . . . . . 45
3.8 Avoiding Common Errors . . . . 45
3.9 Practice Problems . . . . . . . . . . 47
ix
,x Contents
7 Preparation of Solutions and 11.4 Questions . . . . . . . . . . . . . . . 108
Buffers . . . . . . . . . . . . . . . . . . . . . . 77 Resource Materials . . . . . . . . . . . . . 109
B. Pam Ismail
12 Mid-Infrared Spectroscopy
7.1 Introduction . . . . . . . . . . . . . . . 78
Analysis . . . . . . . . . . . . . . . . . . . . . 111
7.2 Preparation of Hydrochloric
Luis Rodriguez-Saona, Siyu Yao,
Acid Solution . . . . . . . . . . . . . 78
and Shreya Madhav Nuguri
7.3 Preparation of Saturated
12.1 Introduction . . . . . . . . . . . . . 111
Sodium Chloride Solution. . . . 79
12.2 Determination of Trans-Fat
7.4 Preparation of Caffeine
Content in Butter and
Standards . . . . . . . . . . . . . . . . . 79
Margarine by Mid-Infrared
7.5 Preparation of a Buffering
Spectroscopy . . . . . . . . . . . . 112
Solution . . . . . . . . . . . . . . . . . . 81
12.3 Questions . . . . . . . . . . . . . . . 118
7.6 Questions. . . . . . . . . . . . . . . . . 82
References . . . . . . . . . . . . . . . . . . . . 118
Resource Material . . . . . . . . . . . . . . 82
13 Moisture Content
8 High-Performance Liquid
Determination . . . . . . . . . . . . . . . . 119
Chromatography . . . . . . . . . . . . . . 83
B. Pam Ismail and
B. Pam Ismail
S. Suzanne Nielsen
and S. Suzanne Nielsen
13.1 Introduction . . . . . . . . . . . . . 120
8.1 Introduction . . . . . . . . . . . . . . . 83
13.2 Forced Draft Oven . . . . . . . . 120
8.2 Determination of Caffeine
13.3 Vacuum Oven . . . . . . . . . . . . 122
in Beverages by HPLC . . . . . . 84
13.4 Microwave Drying Oven . . . 123
Resource Materials . . . . . . . . . . . . . 87
13.5 Rapid Moisture Analyzer . . . 123
9 Gas Chromatography . . . . . . . . . . 89 13.6 Karl Fischer Method . . . . . . 124
B. Pam Ismail and 13.7 Near-Infrared Analyzer . . . . 126
S. Suzanne Nielsen 13.8 Questions . . . . . . . . . . . . . . . 127
9.1 Introduction . . . . . . . . . . . . . . . 89 Resource Materials . . . . . . . . . . . . . 127
9.2 Preparation of Fatty Acid
14 Ash Content Determination . . . . . 129
Methyl Esters (Fames), and
B. Pam Ismail
Determination of Fatty Acid
14.1 Introduction . . . . . . . . . . . . . 129
Profile of Oils by Gas
14.2 Procedure . . . . . . . . . . . . . . . 130
Chromatography . . . . . . . . . . . 90
14.3 Data and Calculations . . . . . 131
Resource Materials . . . . . . . . . . . . . 93
14.4 Questions . . . . . . . . . . . . . . . 131
10 Mass Spectrometry with Resources . . . . . . . . . . . . . . . . . . . . 131
High-Performance Liquid
15 Fat Content Determination . . . . . 133
Chromatography . . . . . . . . . . . . . . 95
B. Pam Ismail and
B. Pam Ismail
S. Suzanne Nielsen
10.1 Introduction . . . . . . . . . . . . . 95
15.1 Introduction . . . . . . . . . . . . . 134
10.2 Procedure . . . . . . . . . . . . . . . 98
15.2 Soxhlet Method . . . . . . . . . . 135
10.3 Data and Calculations . . . . . 99
15.3 Goldfisch Method. . . . . . . . . 136
10.4 Questions . . . . . . . . . . . . . . . 100
15.4 Mojonnier Method . . . . . . . . 137
10.5 Case Study . . . . . . . . . . . . . . 100
15.5 Babcock Method . . . . . . . . . 139
Resource Materials . . . . . . . . . . . . . 102
Resource Materials . . . . . . . . . . . . . 140
11 Determination of Minerals on
16 Protein Nitrogen
Nutrition Label by Atomic
Determination . . . . . . . . . . . . . . . . 141
Absorption Spectroscopy . . . . . . . 103
B. Pam Ismail and
B. Pam Ismail and
S. Suzanne Nielsen
S. Suzanne Nielsen
16.1 Introduction . . . . . . . . . . . . . 141
11.1 Introduction . . . . . . . . . . . . . 103
16.2 Kjeldahl Nitrogen
11.2 Procedure . . . . . . . . . . . . . . . 105
Method . . . . . . . . . . . . . . . . . 142
11.3 Data and Calculations . . . . . 106
,Contents xi
16.3 Nitrogen Combustion 22 Standard Solutions and
Method . . . . . . . . . . . . . . . . . 145 Titratable Acidity . . . . . . . . . . . . . 177
Resource Materials . . . . . . . . . . . . . 146 S. Suzanne Nielsen
22.1 Introduction . . . . . . . . . . . . . 177
17 Total Carbohydrate by
22.2 Preparation and
Phenol-Sulfuric Acid Method. . . . 147
Standardization of Base
S. Suzanne Nielsen
and Acid Solutions . . . . . . . . 178
17.1 Introduction . . . . . . . . . . . . . 147
22.3 Titratable Acidity and pH . . . 180
17.2 Procedure . . . . . . . . . . . . . . . 148
Resource Materials . . . . . . . . . . . . . 182
17.3 Data and Calculations . . . . . 149
17.4 Questions . . . . . . . . . . . . . . . 150 23 Fat Characterization . . . . . . . . . . . 183
Resource Materials . . . . . . . . . . . . . 151 S. Suzanne Nielsen
23.1 Introduction . . . . . . . . . . . . . 184
18 Vitamin C Determination by
23.2 Saponification Value. . . . . . . 184
Indophenol Method. . . . . . . . . . . . 153
23.3 Iodine Value . . . . . . . . . . . . . 186
S. Suzanne Nielsen
23.4 Free Fatty Acid Value . . . . . . 187
18.1 Introduction . . . . . . . . . . . . . 153
23.5 Peroxide Value . . . . . . . . . . . 189
18.2 Procedure . . . . . . . . . . . . . . . 155
23.6 Thin-Layer Chromatography
18.3 Data and Calculations . . . . . 155
Separation of Simple
18.4 Questions . . . . . . . . . . . . . . . 156
Lipids . . . . . . . . . . . . . . . . . . 190
Resource Materials . . . . . . . . . . . . . 156
Resource Materials . . . . . . . . . . . . . 192
19 Water Hardness Testing by
24 Proteins: Extraction, Quantitation,
Complexometric Determination
and Electrophoresis. . . . . . . . . . . . 193
of Calcium . . . . . . . . . . . . . . . . . . . 157
S. Suzanne Nielsen and
S. Suzanne Nielsen
Denise M. Smith
19.1 Introduction . . . . . . . . . . . . . 157
24.1 Introduction . . . . . . . . . . . . . 193
19.2 EDTA Titrimetric Method
24.2 Reagents . . . . . . . . . . . . . . . . 195
for Testing Hardness of
24.3 Supplies . . . . . . . . . . . . . . . . 196
Water . . . . . . . . . . . . . . . . . . 158
24.4 Equipment . . . . . . . . . . . . . . 196
19.3 Test Strips for Water
24.5 Procedure . . . . . . . . . . . . . . . 196
Hardness. . . . . . . . . . . . . . . . 160
24.6 Data and Calculations . . . . . 198
Resource Materials . . . . . . . . . . . . . 161
24.7 Questions . . . . . . . . . . . . . . . 199
20 Phosphorus Determination by Resource Materials . . . . . . . . . . . . . 199
Murphy-Riley Method . . . . . . . . . 163
25 Glucose Determination by
Young-Hee Cho and
Enzyme Analysis . . . . . . . . . . . . . . 201
S. Suzanne Nielsen
B. Pam Ismail and
20.1 Introduction . . . . . . . . . . . . . 163
Robert E. Ward
20.2 Procedure . . . . . . . . . . . . . . . 164
25.1 Introduction . . . . . . . . . . . . . 201
20.3 Data and Calculations . . . . . 165
25.2 Procedure . . . . . . . . . . . . . . . 202
20.4 Questions . . . . . . . . . . . . . . . 165
25.3 Data and Calculations . . . . . 203
Resource Materials . . . . . . . . . . . . . 165
25.4 Questions . . . . . . . . . . . . . . . 203
21 Sodium Determination Using Resource Materials . . . . . . . . . . . . . 203
Ion-Selective Electrodes, Mohr
26 Gliadin Detection by
Titration, and Test Strips . . . . . . . 167
Immunoassay . . . . . . . . . . . . . . . . . 205
S. Suzanne Nielsen
Qinchun Rao
21.1 Introduction . . . . . . . . . . . . . 168
26.1 Introduction . . . . . . . . . . . . . 205
21.2 Ion-Selective Electrodes . . . 168
26.2 Procedure . . . . . . . . . . . . . . . 207
21.3 Mohr Titration . . . . . . . . . . . 170
26.3 Data and Calculations . . . . . 208
21.4 Quantab® Test Strips . . . . . . 172
26.4 Questions . . . . . . . . . . . . . . . 208
21.5 Summary of Results . . . . . . . 174
Resource Materials . . . . . . . . . . . . . 209
21.6 Questions . . . . . . . . . . . . . . . 174
Resource Materials . . . . . . . . . . . . . 175
,xii Contents
27 Rheological Measurements 29.5 Extraneous Matter in
of Food Products . . . . . . . . . . . . . . 211 Potato Chips . . . . . . . . . . . . . 229
Helen S. Joyner 29.6 Extraneous Matter in
27.1 Introduction . . . . . . . . . . . . . 211 Citrus Juice. . . . . . . . . . . . . . 229
27.2 Viscosity Measurement by 29.7 Questions . . . . . . . . . . . . . . . 230
Brookfield Viscometer . . . . . 212 Resource Materials . . . . . . . . . . . . . 230
27.3 Viscosity Measurement by
30 Food Forensics . . . . . . . . . . . . . . . . 231
Bostwick Consistometer . . . 213
Jinping Dong
27.4 Large-Strain Compression
30.1 Introduction . . . . . . . . . . . . . 231
Measurement . . . . . . . . . . . . 214
30.2 Assessing Foreign
27.5 Questions . . . . . . . . . . . . . . . 216
Materials in a Powdered
Resource Materials . . . . . . . . . . . . . 217
Food Product . . . . . . . . . . . . 232
28 Color Measurements of a 30.3 Forensics Report . . . . . . . . . 234
Solid and Calculation of 30.4 Questions . . . . . . . . . . . . . . . 234
Color Specifications from Resource Materials . . . . . . . . . . . . . 234
Spectral Data . . . . . . . . . . . . . . . . . 219
M. Monica Giusti, Part III Answers to Practice Problems
Danielle M. Voss, and
Gonzalo Miyagusuku-Cruzado 31 Answers to Practice Problems
28.1 Introduction . . . . . . . . . . . . . 219 in Chapter 2, Preparation of
28.2 Procedure . . . . . . . . . . . . . . . 220 Reagents and Buffers . . . . . . . . . . 237
28.3 Questions . . . . . . . . . . . . . . . 223 Catrin Tyl and B. Pam Ismail
Resource Materials . . . . . . . . . . . . . 223
32 Answers to Practice Problems in
29 Extraneous Matter Chapter 3, Dilutions and
Examination. . . . . . . . . . . . . . . . . . 225 Concentrations . . . . . . . . . . . . . . . 243
S. Suzanne Nielsen Andrew P. Neilson
29.1 Introduction . . . . . . . . . . . . . 226
33 Answers to Practice Problems in
29.2 Extraneous Matter in
Chapter 4, Use of Statistics in
Soft Cheese . . . . . . . . . . . . . 227
Food Analysis . . . . . . . . . . . . . . . . . 249
29.3 Extraneous Matter in Jam . . 227
Andrew P. Neilson
29.4 Extraneous Matter in
Infant Food . . . . . . . . . . . . . . 228
, Laboratory Standard Operating
Procedures 1
Andrew P. Neilson
Contents
1.1 Introduction 4
1.2 Precision and Accuracy 4
1.3 Balances 5
1.3.1 Types of Balances 5
1.3.2 Choice of Balance 5
1.3.3 Use of Top Loading Balances 6
1.3.4 Use of Analytical Balances 6
1.3.5 Additional Information 6
1.4 Mechanical Pipettes 7
1.4.1 Operation 7
1.4.2 Pre-Rinsing 7
1.4.3 Pipetting Solutions of Varying Density or Viscosity 8
1.4.4 Performance Specifications 8
1.4.5 Selecting the Correct Pipette 8
1.5 Glassware 8
1.5.1 Types of Glassware/Plasticware 8
1.5.2 Choosing Glassware/Plasticware 9
1.5.3 Volumetric Glassware 9
1.5.4 Using Volumetric Glassware to Perform Dilutions and Concentrations 10
1.5.5 Conventions and Terminology 13
1.5.6 Burets 14
1.5.7 Cleaning of Glass and Porcelain 15
1.6 Reagents 15
1.6.1 Acids 15
1.6.2 Distilled Water 15
1.6.3 Water Purity 16
1.6.4 Carbon-Dioxide-Free Water 16
1.6.5 Preparing Solutions and Reagents 16
1.7 Data Handling and Reporting 17
1.7.1 Significant Figures 17
1.7.2 Rounding Off Numbers 17
1.7.3 Rounding Off Single Arithmetic Operations 17
1.7.4 Rounding Off the Results of a Series of Arithmetic Operations 18
1.8 Basic Laboratory Safety 18
1.8.1 Safety Data Sheets 18
1.8.2 Hazardous Chemicals 18
A. P. Neilson (*)
Department of Food, Bioprocessing and Nutrition Sciences, North
Carolina State University, Raleigh, NC, USA
e-mail:
© The Author(s), under exclusive license to Springer Nature Switzerland AG 2024 3
B. P. Ismail, S. S. Nielsen (eds.), Nielsen’s Food Analysis Laboratory Manual, Food Science Text Series,
https://doi.org/10.1007/978-3-031-44970-3_1
,4 A. P. Neilson
1.8.3 Personal Protective Equipment and Safety Equipment 18
1.8.4 Eating, Drinking, Etc. 19
1.8.5 Miscellaneous Information 19
Resource Materials 19
1.1 INTRODUCTION sion of precision and accuracy. The smaller these values are,
the more reproducible or precise the measurement is.
This chapter is designed to cover essential “standard operat- Precision is determined not on reference standards, but by
ing procedures” (SOPs), or best practices, for a general food the use of actual food samples, which cover a range of con-
analysis laboratory. The topics covered in this chapter centrations and a variety of interfering materials usually
include balances, mechanical pipettes, glassware, reagents, encountered by the analyst. Obviously, such data should not
precision and accuracy, data handling, data reporting, and be collected until the analyst is familiar with the method and
safety. These procedures apply to all the laboratory experi- has obtained a reproducible standard curve (a mathematical
ments in this manual, and therefore a thorough review of relationship between the analyte concentration and the ana-
general procedures will be invaluable for successful comple- lytical response). There are a number of different methods
tion of these laboratory exercises as well as development of available for the determination of precision. One method
sound laboratory skills. follows:
This manual covers many of the basic skills and informa-
tion that are necessary for one to be a good analytical food 1. Three separate concentration levels should be studied,
chemist. Much of this material is the type that one typically including a low concentration near the sensitivity level of
“picks up” from experience over time working in a labora- the method, an intermediate concentration, and a concen-
tory. Nothing can replace actual lab experience as a learning tration near the upper limit of application of the method.
tool, but hopefully this manual will help students learn 2. Seven replicate determinations should be made at each of
proper lab techniques early rather than having to correct the concentrations tested.
improper habits later. When one reads this manual, your 3. To allow for changes in instrument conditions, the preci-
reaction may be “is all of this attention to detail necessary?” sion study should cover at least 2 hours of normal labora-
Admittedly, the answer is “not always.” This brings to mind tory operation.
an old Irish proverb that “the best person for a job is the one 4. To permit the maximum interferences in sequential oper-
that knows what to ignore.” There is much truth to this prov- ation, it is suggested that the samples be run in the follow-
erb, but a necessary corollary is that one must know what ing order: high, low, and intermediate. This series is then
they are ignoring. The decision to use something other than repeated seven times to obtain the desired replication.
the “best” technique must be conscious decision and not one 5. The precision statement should include a range of stan-
made from ignorance. This decision must be based not only dard deviations over the tested range of concentration.
upon knowledge of the analytical method being used but also Thus, three standard deviations will be obtained over a
on how the resulting data will be used. Much of the informa- range of three concentrations.
tion in this manual has been obtained from an excellent pub-
lication by the US Environmental Protection Agency entitled Accuracy refers to the degree (absolute or relative) of dif-
Handbook for Analytical Quality Control in Water and ference between observed and “actual” or “true” values. The
Wastewater Laboratories. “actual” value is often difficult to ascertain or unknown. It
may be the value obtained by a standard reference method
(the accepted manner of performing a measurement).
1.2 PRECISION AND ACCURACY Another means of evaluating accuracy is by the addition of a
known amount of the material being analyzed for the food
To understand many of the concepts in this chapter, rigorous sample and then calculation of % recovery. This latter
definition of the terms “precision” and “accuracy” is required approach entails the following steps:
here. These terms are often used incorrectly, or are used
interchangeably (also incorrect). Precision refers to the 1. Known amounts of the particular constituent are added to
reproducibility of replicate observations, typically mea- actual samples at concentrations for which the precision
sured as standard deviation (SD), standard error (SE), or of the method is satisfactory. It is suggested that amounts
coefficient of variation (CV). Refer to Chap. 4 in this labo- be added to the low-concentration sample, sufficient to
ratory manual and Smith (2024) for a more complete discus- double that concentration, and that an amount be added to
,1 Laboratory Standard Operating Procedures 5
the intermediate concentration, sufficient to bring the 1.3 BALANCES
final concentration in the sample to approximately 75%
of the upper limit of application of the method. 1.3.1 Types of Balances
2. Seven replicate determinations at each concentration are
made. Balances quantify mass, or amount of matter (commonly
3. Accuracy is reported as the percent recovery at the final referred to as “weight,” although weight is technically a
concentration of the spiked sample. Percent recovery at function of mass and the force of gravity). This is a key
each concentration is the mean of the seven replicate measurement for analytical chemistry, particularly quanti-
results. tative methods. Two general types of balances are used in
most laboratories. These are top loading balances and
A fast, less rigorous means to evaluate precision and analytical balances. Top loading balances usually are sen-
accuracy is to analyze a food sample and replicate a spiked sitive to 0.1–0.001 g, depending on the specific model in
food sample, and then calculate the recovery of the amount use (this means that they can measure differences in the
spiked. An example is shown in Table 1.1. mass of a sample to within 0.1–0.001 g). In, general, as the
The accuracy can then be measured by calculating the % capacity (largest mass that can be measured) increases, the
of the spike (0.75 g/L) detected by comparing the measured sensitivity decreases. In other words, balances that can
values from the unspiked and spiked samples: measure larger masses generally measure differences in
those masses to fewer decimal places. Analytical balances
accuracy ≈ % recovery = are usually sensitive to 0.001–0.00001 g, depending on the
measured spiked sample specific model. It should be remembered, however, that
×100%
measured sample + amount of spike (1.1) sensitivity (ability to detect small differences in mass) is
not necessarily equal to accuracy (the degree to which the
accuracy ≈ % recovery = balances correctly report the actual mass). The fact that a
2.0955g / L balance can be read to 0.01 mg does not necessarily mean
× 100% = 102.44% it is accurate to 0.01 mg. What this means is that the bal-
1.2955g / L + 0.75g / L
ance can distinguish between masses that differ by 0.01 mg,
The method measured the spike to within 2.44%. By add- but may not accurately measure those masses to within
ing 0.75 g/L Ca to a sample that was measured to have 0.01 mg of the actual masses (because the last digit is often
1.2955 g/L Ca, a perfectly accurate method would result in a rounded). The accuracy of a balance is independent of its
spiked sample concentration of: sensitivity.
1.2955 g/L + 0.75 g/L = 2.0455 g/L.
The method actually measured the spiked sample at 1.3.2 Choice of Balance
2.0955 g/L, which is 2.44% greater than it should be.
Therefore, the accuracy is estimated at ~2.44% relative error. Which type of balance to use depends on “how much accu-
racy” is needed in a given measurement. One way to deter-
mine this is by calculating how much relative (%) error
Table 1.1 Measured calcium content (g/L) of milk and spiked milk
would be introduced by a given type of balance. For instance,
Replicate Milk Milk + 0.75 g Ca/L
if 0.1 g of a reagent was needed, weighing it on a top loading
1 1.29 2.15
balance accurate to within only ±0.02 g of the actual mass
2 1.40 2.12
3 1.33 2.20
would introduce approximately 20% error:
4 1.24 2.27 % error in measured mass
5 1.23 2.07 absolute error in measured mass
6 1.40 2.10 = ×100%
measured mass (1.2)
7 1.24 2.20
8 1.27 2.07
9 1.24 1.74 0.02 g
% error in measured mass = × 100% = 20%
10 1.28 2.01 0.1g
11 1.33 2.12
Mean 1.2955 2.0955 This would clearly be unacceptable in most situations.
SD 0.062 0.138 Therefore, a more accurate balance would be needed.
%CV 4.8 6.6 However, the same balance (with accuracy to within
,6 A. P. Neilson
±0.02 g) would probably be acceptable for weighing out operation of an analytical balance. If it has been a while
100 g of reagent, as the error would be approximately since you have used a specific type of analytical balance, it
0.02%: may be helpful to “practice” before actually weighing a
sample by weighing a spatula or other convenient article.
0.02 g The following general rules apply to most analytical bal-
% error in measured mass = × 100% = 0.02%
100 g ances and should be followed to ensure that accurate results
are obtained and that the balance is not damaged by
The decision on “how much accuracy” is needed can only
improper use:
be answered when one knows the function of the reagent in
the analytical method. This is one reason why it is necessary
1. Analytical balances are expensive precision instruments;
to understand the principles involved in an analytical method,
treat them as such.
and not to simply approach an analytical method in a cook-
2. Make sure that the balance is level and is on a sturdy table
book fashion. Therefore, a general guideline regarding which
or bench free of vibrations.
balance to use is hard to define.
3. Once these conditions are met, the same procedure speci-
Another situation in which care must be exercised in
fied above for top loading balances is used to weigh the
determining what type of balance to use is when a difference
sample on an analytical balance.
in masses is to be calculated. For instance, a dried crucible to
4. Always leave the balance clean.
be used in a total ash determination may weigh 20.05 g on a
top loading balance, crucible plus sample = 25.05 g, and the
ashed crucible 20.25 g. It may appear that the use of the top
loading balance with its accuracy of ±0.02 g would introduce 1.3.5 Additional Information
approximately 0.1% error, which would often be acceptable.
Actually, since a difference in weight (0.20 g) is being deter- Other points to be aware of regarding the use of balances are
mined, the error would be approximately 10% and thus unac- the following:
ceptable. In this case, an analytical balance is definitely
required because sensitivity is required in addition to 1. Many analyses (moisture, ash, etc.) require weighing of
accuracy. the final dried or ashed sample with the vessel in which
the sample was dried or ashed. The mass of the vessel
must be known so that it can be subtracted from the final
1.3.3 Use of Top Loading Balances mass to get the mass of the dried sample or ash. Therefore,
make sure to obtain the mass of the vessel before the anal-
These instructions are generalized but apply to use of most ysis. This can be done by either weighing the vessel
models of top loading balances: before taring the balance and then adding the sample or
obtaining the mass of the vessel and then the mass of the
1. Level the balance using the bubble level and the adjust- vessel plus the sample.
able feet (leveling is required so that the balance performs 2. The accumulation of moisture from the air or fingerprints
correctly). on the surface of a vessel will add a small mass to the
2. Either zero the balance (so the balance reads 0 with noth- sample. This can introduce errors in mass that affect ana-
ing on the pan) or tare the balance so that the balance lytical results, particularly when using analytical bal-
reads 0 with a container that will hold the sample (empty ances. Therefore, beakers, weigh boats, and other
beaker, weighing boat, etc.) on the weighing pan. The tare weighing vessels should be handled with tongs or with
function is conveniently used for “subtracting” the weight gloved hands. For precise measurements (moisture, ash,
of the beaker or weighing boat into which the sample is and other measurements), weighing vessels should be
added. pre-dried and stored in a desiccator before use, and then
3. Weigh the sample. stored in a desiccator after drying, ashing, etc., prior to
weighing the cooled sample.
3. Air currents or leaning on the bench can cause apprecia-
1.3.4 Use of Analytical Balances ble error in analytical balances. It is best to take the read-
ing after closing the side doors of an analytical balance.
It is always wise to consult the specific instruction manual 4. Most balances in modern laboratories are electric bal-
for an analytical balance before using it. Speed and accu- ances. Older lever-type balances are no longer in wide
racy are both dependent on one being familiar with the use, but they are extremely reliable.
, 1 Laboratory Standard Operating Procedures 7
1.4 MECHANICAL PIPETTES Table 1.3 Appropriate dispense wait time for automatic pipettors
Pipette Time (s)
Mechanical pipettes (i.e., automatic pipettors) are stan- P-20D, P-100D, P-200D 1
dard equipment in most analytical laboratories. This is due P-500D, P-1000D 1–2
to their convenience, precision, and acceptable accuracy P-5000D 2–3
when used properly, and when calibrated. Although these
pipettes are often viewed as being easier to use than conven- 5. Allow the plunger to slowly return to the “up” position.
tional glass volumetric pipettes, this does not mean that the Never permit it to snap up (this will suck liquid up into
necessary accuracy and precision can be obtained without the pipette mechanism, causing inaccurate measurement
attention to proper pipetting technique. Just the opposite is and damaging the pipette).
the case; if mechanical pipettes are used incorrectly, this 6. Wait 1–2 s to ensure that full volume of sample is drawn
will usually cause greater error than the misuse of glass into tip. If the solution is viscous such as glycerol, you
volumetric pipettes. Improper pipetting technique is wide- need to allow more time.
spread and contributes significant error to analytical mea- 7. Withdraw tip from sample liquid. Should any liquid
surements. The proper use of glass volumetric pipettes is remain on outside of tip, wipe carefully with a lint-free
discussed in the section on glassware. The pipetman cloth, taking care not to touch the tip opening.
mechanical pipette (Gilson Inc.) is an example of a continu- 8. To dispense sample, place tip end against side wall of
ously adjustable design. The proper use of this type of vessel and depress plunger slowly past the first stop until
pipette, as recommended by the manufacturer, will be the second stop (fully depressed position) is reached.
described here. Other brands of mechanical pipettes are 9. Wait (Table 1.3).
available, and although their specific instructions should be 10. With plunger fully depressed, withdraw mechanical
followed, their proper operation is usually very similar to pipette from the vessel carefully with tip sliding along
that described here. wall of vessel.
11. Allow plunger to return to top position.
12. Discard tip by depressing tip-ejector button smartly.
1.4.1 Operation 13. A fresh tip should be used for the next measurement if:
(a) A different solution or volume is to be pipetted.
1. Set the desired volume on the digital micrometer/volu- (b) A significant residue exists in the tip (not to be con-
meter. For improved precision, always approach the fused with the visible “film” left by some viscous or
desired volume by dialing downward from a larger vol- organic solutions).
ume setting. Make sure not to wind it up beyond its max-
imum capacity; this will break it beyond repair.
2. Attach a disposable tip to the shaft of the pipette and 1.4.2 Pre-Rinsing
press on firmly with a slight twisting motion to ensure a
positive, airtight seal. Pipetting very viscous solutions or organic solvents will
3. Depress the plunger to the first positive stop. This part result in a significant film being retained on the inside wall
of the stroke is the calibrated volume displayed. Going of the tip. This will result in an error that will be larger than
past the first positive stop will cause inaccurate the tolerance specified if the tip is only filled once. Since
measurement. this film remains relatively constant in successive pipet-
4. Holding the mechanical pipette vertically, immerse the tings with the same tip, accuracy may be improved by fill-
disposable tip into sample liquid to a depth indicated ing the tip, dispensing the volume into a waste container,
(Table 1.2), specific to the maximum volume of the refilling the tip a second time, and using this quantity as the
pipette (P-20, 100, 200, 500, 1000, and 5000, which cor- sample. This procedure is recommended in all pipetting
respond to maximum volumes of 20, 100, 200, 500, operations when critical reproducibility is required,
1000, and 5000 μL, respectively). whether or not tips are reused (same solution) or changed
(different solutions/different volumes). Note that the “non-
Table 1.2 Appropriate pipette depth for automatic pipettors wettability” of the polypropylene tip is not absolute and
Pipette Depth (mm) that pre-rinsing will improve the precision and accuracy
P-20D, P-100D, P-200D 1–2 when pipetting any solution.
P-500D, P-1000D 2–4
P-5000D 3–6