Voting B ehaviour
Ration al choice theor y:
Voters are seen as making decisions based on self-interest. For example, working-
class voters might choose Labour for promises of stronger welfare, while middle-
class voters might lean Conservative for lower taxes—if those align with their
perceived interests.
Factor s aff ecting voting behaviour
Class-based votin g:
Pre 1970 saw large class-based voting, with A, B and C1 voters supporting the
Conservatives. However, since then there has been large partisan dealignment. For
example, in 2017, Jeremy Corbyn gained large votes from the AB social category,
whilst Theresa May made striking gains amongst DE voters. This was because pro-
European high social class members of society wanted to punish the Conservatives,
and the DE voters felt like the conservatives would deliver Brexit better.
Region :
The South-East is the most prosperous region in the UK with high levels of
homeownership and little tradition of heavy industrial trade unionism. The
Conservatives do disproportionately well there. Ethnically white rural parts of the UK
such as East Anglia and the south coast are also classic Conservative territory
Labour, meanwhile, has dominated ethnically diverse big cities with large working-
class populations and major centres of industrial productions such as South Wales,
Merseyside, Greater Manchester and Tyne and Wear
As a rule, the industrial north of England has been more likely to vote Labour and the
south of England Conservative.
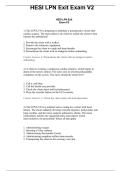
Age:
The Conservative party’s support is strongest amongst older voters while the Labour
and Liberal Democrat parties have generally won support of younger votes. This is
because the Conservative party has traditionally emphasise policies such as low
, taxation, strong national defence, law and order and in recent years has been
significantly more Eurosceptic than labour and the Lib Dems, these policies appeal to
the older property-owning voters who tend to favour security, stability and having
more financial responsibility and savings.
2019 Labou r 2019 Conser vatives 2019 Lib Dem s
18-24: 62% 18-24: 19% 18-24: 9%
25-34: 51% 25-34: 27% 25-34: 11%
55-64: 27% 55-64: 49% 55-64% 11%
65+: 17% 65+: 64% 65+: 11%
This is important as there is a large turnout difference between young and old voters.
In 2019, only 47% of 18-24 year olds voted, whereas 74% of 65+ voted.
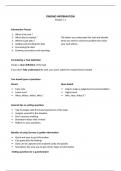
Eth n icity:
Some elements within the Conservative party have made it seem hostile towards
immigrant communities. In the 2017 election, the Conservatives won just 5 of the 75
most ethnically diverse constituencies in the UK. Whereas Labour won 46 of the 73
seats in London, which is 36.8% white British
Shar e of m in or ity ethn ic vote in
2019 election
Labour 64%
Conservative 20%
Lib Dems 12%
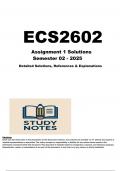
Education :
The impact of education and voting behaviour significantly changed in 2017 general
action those with higher educational qualifications comprise the top social brackets
and have traditionally been more likely to vote Conservative. However, in the 2017
election there was a remarkable change in voting patterns with the conservatives
increasing their support among those with fewest qualifications and labour achieving
high levels support among those with degrees in the top brackets. The 2019 general
election results suggest this may have been part of a long-term trend in which the
Conservatives have aligned themselves with strictly controls and immigration in
increasing their support them on white working-class voters who feel threatened by
globalisation and so decisively voted for Brexit
2019 GE Labour 2019 GE Conservatives
Degree or higher 39% of vote 34% of vote
No qualifications 23% of vote 59% of vote
Ration al choice theor y:
Voters are seen as making decisions based on self-interest. For example, working-
class voters might choose Labour for promises of stronger welfare, while middle-
class voters might lean Conservative for lower taxes—if those align with their
perceived interests.
Factor s aff ecting voting behaviour
Class-based votin g:
Pre 1970 saw large class-based voting, with A, B and C1 voters supporting the
Conservatives. However, since then there has been large partisan dealignment. For
example, in 2017, Jeremy Corbyn gained large votes from the AB social category,
whilst Theresa May made striking gains amongst DE voters. This was because pro-
European high social class members of society wanted to punish the Conservatives,
and the DE voters felt like the conservatives would deliver Brexit better.
Region :
The South-East is the most prosperous region in the UK with high levels of
homeownership and little tradition of heavy industrial trade unionism. The
Conservatives do disproportionately well there. Ethnically white rural parts of the UK
such as East Anglia and the south coast are also classic Conservative territory
Labour, meanwhile, has dominated ethnically diverse big cities with large working-
class populations and major centres of industrial productions such as South Wales,
Merseyside, Greater Manchester and Tyne and Wear
As a rule, the industrial north of England has been more likely to vote Labour and the
south of England Conservative.
Age:
The Conservative party’s support is strongest amongst older voters while the Labour
and Liberal Democrat parties have generally won support of younger votes. This is
because the Conservative party has traditionally emphasise policies such as low
, taxation, strong national defence, law and order and in recent years has been
significantly more Eurosceptic than labour and the Lib Dems, these policies appeal to
the older property-owning voters who tend to favour security, stability and having
more financial responsibility and savings.
2019 Labou r 2019 Conser vatives 2019 Lib Dem s
18-24: 62% 18-24: 19% 18-24: 9%
25-34: 51% 25-34: 27% 25-34: 11%
55-64: 27% 55-64: 49% 55-64% 11%
65+: 17% 65+: 64% 65+: 11%
This is important as there is a large turnout difference between young and old voters.
In 2019, only 47% of 18-24 year olds voted, whereas 74% of 65+ voted.
Eth n icity:
Some elements within the Conservative party have made it seem hostile towards
immigrant communities. In the 2017 election, the Conservatives won just 5 of the 75
most ethnically diverse constituencies in the UK. Whereas Labour won 46 of the 73
seats in London, which is 36.8% white British
Shar e of m in or ity ethn ic vote in
2019 election
Labour 64%
Conservative 20%
Lib Dems 12%
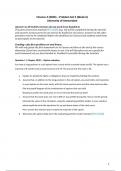
Education :
The impact of education and voting behaviour significantly changed in 2017 general
action those with higher educational qualifications comprise the top social brackets
and have traditionally been more likely to vote Conservative. However, in the 2017
election there was a remarkable change in voting patterns with the conservatives
increasing their support among those with fewest qualifications and labour achieving
high levels support among those with degrees in the top brackets. The 2019 general
election results suggest this may have been part of a long-term trend in which the
Conservatives have aligned themselves with strictly controls and immigration in
increasing their support them on white working-class voters who feel threatened by
globalisation and so decisively voted for Brexit
2019 GE Labour 2019 GE Conservatives
Degree or higher 39% of vote 34% of vote
No qualifications 23% of vote 59% of vote