Solutions Manual – Probability And Statistics For Engineers An
Scientists, Updated 9th Edition, By Pearson
iii
, Contents
1 Introduction To Statistics And Data Analysis 1
2 Probability 11
3 Random Variables And Probability Distributions 27
4 Mathematical Expectation 41
5 Some Discrete Probability Distributions 55
6 Some Continuous Probability Distributions 67
7 Functions Of Random Variables 79
8 Fundamental Sampling Distributions And Data Descriptions 85
9 One- And Two-Sample Estimation Problems 97
10 One- And Two-Sample Tests Of Hypotheses 113
11 Simple Linear Regression And Correlation 139
12 Multiple Linear Regression And Certain Nonlinear Regression Models 161
13 One-Factor Experiments: General 175
14 Factorial Experiments (Two Or More Factors) 197
15 2k Factorial Experiments And Fractions 219
16 Nonparametric Statistics 233
17 Statistical Quality Control 247
Bayesian Statistics
,Chapter 1
Introduction To Statistics And Data
Analysis
1.1 (A) 15.
(b) X̄ = 1
15
(3.4+ 2.5+ 4.8+ · · · + 4.8) = 3.787.
(c) Sample Median Is The 8th Value, After The Data Is Sorted From Smallest To Largest: 3.6.
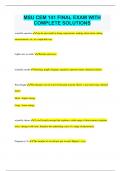
(d) A Dot Plot Is Shown Below.
2.5 3.0 3.5 4.0 4.5 5.0 5.5
(e) After Trimming Total 40% Of The Data (20% Highest And 20% Lowest), The Data Becomes:
2.9 3.0 3.3 3.4 3.6
3.7 4.0 4.4 4.8
So. The Trimmed Mean
Is 1
X̄ T r 2 0 = (2.9+ 3.0+ · · · + 4.8) = 3.678.
9
(f) They Are About The Same.
1.2 (A) Mean=20.7675 And Median=20.610.
(b) X̄ T r 1 0 = 20.743.
(c) A Dot Plot Is Shown Below.
18 19 20 21 22 23
(d) No. They Are All Close To Each Other.
Copyright ⃝C 2012 Pearson Education, Inc. Publishing As Prentice Hall.
1
, 2 Chapter 1 Introduction to Statistics and Data Analysis
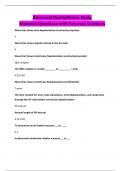
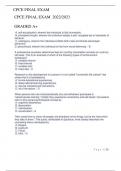
1.3 (A) A Dot Plot Is Shown Below.
200 205 210 215 220 225 230
In The Figure, “×” Represents The “No Aging” Group And “◦” Represents The
“Aging” Group.
(b) Yes; Tensile Strength Is Greatly Reduced Due To The Aging Process.
(c) Meanaging = 209.90, And Meanno Aging = 222.10.
(d) Medianaging = 210.00, And Medianno Aging = 221.50. The Means And Medians For Each
Group Are Similar To Each Other.
1.4 (A) X̄ A = 7.950 And X˜ a = 8.250;
X̄ B = 10.260 And X̃ b = 10.150.
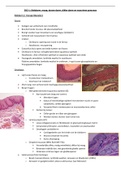
(b) A Dot Plot Is Shown Below.
6.5 7.5 8.5 9.5 10.5 11.5
In The Figure, “×” Represents Company A And “◦” Represents Company B. The Steel
Rods Made By Company B Show More Flexibility.
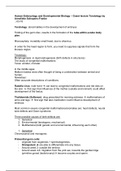
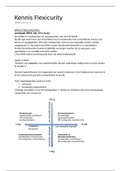
1.5 (A) A Dot Plot Is Shown Below.
−10 0 10 20 30 40
In The Figure, “×” Represents The Control Group And “◦” Represents The Treatment Group.
(b) X̄ Control = 5.60, X̃ control = 5.00, And X̄Tr(10);Control = 5.13;
X̄ Treatment = 7.60, X̃ treatment = 4.50, And X̄Tr(10);Treatment = 5.63.
(c) The Difference Of The Means Is 2.0 And The Differences Of The Medians And The
Trimmed Means Are 0.5, Which Are Much Smaller. The Possible Cause Of This Might Be
Due To The Extreme Values (Outliers) In The Samples, Especially The Value Of 37.
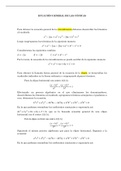
1.6 (A) A Dot Plot Is Shown Below.
1.95 2.05 2.15 2.25 2.35 2.45 2.55
In The Figure, “×” Represents The 20◦C Group And “◦” Represents The 45◦C Group.
(B) X̄ 20 ◦ C = 2.1075, And X̄ 45 ◦ C = 2.2350.
(c) Based On The Plot, It Seems That High Temperature Yields More High Values Of Tensile
Strength, Along With A Few Low Values Of Tensile Strength. Overall, The Temperature Does
Have An Influence On The Tensile Strength.
(d) It Also Seems That The Variation Of The Tensile Strength Gets Larger When The Cure
Temper- Ature Is Increased.
1.7 S2 = [(3.4 — 3.787)2 + (2.5 — 3.787)2 + (4.8 — 3.787)2 + · · · + (4.8 — 3.787)2] = 0.94284;
1
√1 5—1 √
S = S2 = 0.9428 = 0.971.
Copyright ⃝c 2012 Pearson Education, Inc. Publishing as Prentice Hall.
Scientists, Updated 9th Edition, By Pearson
iii
, Contents
1 Introduction To Statistics And Data Analysis 1
2 Probability 11
3 Random Variables And Probability Distributions 27
4 Mathematical Expectation 41
5 Some Discrete Probability Distributions 55
6 Some Continuous Probability Distributions 67
7 Functions Of Random Variables 79
8 Fundamental Sampling Distributions And Data Descriptions 85
9 One- And Two-Sample Estimation Problems 97
10 One- And Two-Sample Tests Of Hypotheses 113
11 Simple Linear Regression And Correlation 139
12 Multiple Linear Regression And Certain Nonlinear Regression Models 161
13 One-Factor Experiments: General 175
14 Factorial Experiments (Two Or More Factors) 197
15 2k Factorial Experiments And Fractions 219
16 Nonparametric Statistics 233
17 Statistical Quality Control 247
Bayesian Statistics
,Chapter 1
Introduction To Statistics And Data
Analysis
1.1 (A) 15.
(b) X̄ = 1
15
(3.4+ 2.5+ 4.8+ · · · + 4.8) = 3.787.
(c) Sample Median Is The 8th Value, After The Data Is Sorted From Smallest To Largest: 3.6.
(d) A Dot Plot Is Shown Below.
2.5 3.0 3.5 4.0 4.5 5.0 5.5
(e) After Trimming Total 40% Of The Data (20% Highest And 20% Lowest), The Data Becomes:
2.9 3.0 3.3 3.4 3.6
3.7 4.0 4.4 4.8
So. The Trimmed Mean
Is 1
X̄ T r 2 0 = (2.9+ 3.0+ · · · + 4.8) = 3.678.
9
(f) They Are About The Same.
1.2 (A) Mean=20.7675 And Median=20.610.
(b) X̄ T r 1 0 = 20.743.
(c) A Dot Plot Is Shown Below.
18 19 20 21 22 23
(d) No. They Are All Close To Each Other.
Copyright ⃝C 2012 Pearson Education, Inc. Publishing As Prentice Hall.
1
, 2 Chapter 1 Introduction to Statistics and Data Analysis
1.3 (A) A Dot Plot Is Shown Below.
200 205 210 215 220 225 230
In The Figure, “×” Represents The “No Aging” Group And “◦” Represents The
“Aging” Group.
(b) Yes; Tensile Strength Is Greatly Reduced Due To The Aging Process.
(c) Meanaging = 209.90, And Meanno Aging = 222.10.
(d) Medianaging = 210.00, And Medianno Aging = 221.50. The Means And Medians For Each
Group Are Similar To Each Other.
1.4 (A) X̄ A = 7.950 And X˜ a = 8.250;
X̄ B = 10.260 And X̃ b = 10.150.
(b) A Dot Plot Is Shown Below.
6.5 7.5 8.5 9.5 10.5 11.5
In The Figure, “×” Represents Company A And “◦” Represents Company B. The Steel
Rods Made By Company B Show More Flexibility.
1.5 (A) A Dot Plot Is Shown Below.
−10 0 10 20 30 40
In The Figure, “×” Represents The Control Group And “◦” Represents The Treatment Group.
(b) X̄ Control = 5.60, X̃ control = 5.00, And X̄Tr(10);Control = 5.13;
X̄ Treatment = 7.60, X̃ treatment = 4.50, And X̄Tr(10);Treatment = 5.63.
(c) The Difference Of The Means Is 2.0 And The Differences Of The Medians And The
Trimmed Means Are 0.5, Which Are Much Smaller. The Possible Cause Of This Might Be
Due To The Extreme Values (Outliers) In The Samples, Especially The Value Of 37.
1.6 (A) A Dot Plot Is Shown Below.
1.95 2.05 2.15 2.25 2.35 2.45 2.55
In The Figure, “×” Represents The 20◦C Group And “◦” Represents The 45◦C Group.
(B) X̄ 20 ◦ C = 2.1075, And X̄ 45 ◦ C = 2.2350.
(c) Based On The Plot, It Seems That High Temperature Yields More High Values Of Tensile
Strength, Along With A Few Low Values Of Tensile Strength. Overall, The Temperature Does
Have An Influence On The Tensile Strength.
(d) It Also Seems That The Variation Of The Tensile Strength Gets Larger When The Cure
Temper- Ature Is Increased.
1.7 S2 = [(3.4 — 3.787)2 + (2.5 — 3.787)2 + (4.8 — 3.787)2 + · · · + (4.8 — 3.787)2] = 0.94284;
1
√1 5—1 √
S = S2 = 0.9428 = 0.971.
Copyright ⃝c 2012 Pearson Education, Inc. Publishing as Prentice Hall.