Case 1:
Isometric, surface-volume ratio = 2/3 because:
m2 / m3 = 2/3
1. Definition of isometry and allometry.
2. What are the scaling laws of animal functions (cell size, surface area-
volume ratio)?
3. What is the relation between stroke frequency, wing size and body
size? (lift force/drag force needed to fly (basic understanding))
4. How does heart rate vary with body size? How does ventilation rate
vary with body size? (give examples)
5. How does bone characteristics vary with body size?
6. How does the weight of the organ vary with body size?
7. What to scale for? (body mass, body length, surface area)
8. Provide arguments why or why not the horse can/cannot fly? How
could it be remodelled?
What are the limits for everything (body size, cell size, surface area-
volume)
, 1. Definition of isometry and allometry.
Allometry: how characteristics of living creatures change with size. It
refers to biological scaling relationships in general for morphological traits
(brain vs body size), physiological traits (metabolic rate vs body size) or
ecological traits (wing size vs flight performance). Allometry describes
how traits or processes scale with one another.
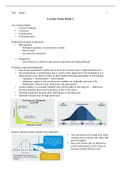
When plotted on a log-log scale scaling relationships could be described
using the simple linear equation:
log y=α∗log x+ log b
x = body size y = organ size log b = intercept of line on
y-axis
alpha = slope of line (allometric coefficient)
When the organ has a higher growth rate than the body alpha > 1
(positive allometry / hyperallometry). When the organ has a lower
growth rate than the body as a whole alpha < 1 which is called negative
allometry or hypoallometry.
When an organ grows at the same are as the rest of the body alpha = 1,
which is called isometry. This organ maintains a constant proportionate
size throughout the development.
Different kinds of allometry:
Ontogenic allometry: x and y are measured in the same individual
through developmental time
o The slope reflects different in growth rate between an organ
and body size
Static allometry: x and y are measured in different individuals at
the same developmental stage within a population or species
o The slope reflects how variation in trait size is accompanied by
variation in body size within a species
Evolutionary allometry: x and y are measured in different species
o The slope reflects how variation in trait size is accompanied by
variation in body size between species
Differences in the intercept (b) of the allometry between species indicates
differences in proportionate size of the wing (in butterflies) irrespective of
,body size. Differences in the slope (alpha) indicates differences in how
relative size of the wing changes with body size within a species.
2. What are the scaling laws of animal functions (cell size,
surface area-volume ratio)?
Most biological systems follow a power curve when plotted an x-y plot
which is why we use a log-log scale to make the understanding easier
since it transforms it to a linear relationship. This can reveal fundamental
patterns which can be explained by a few general scaling “laws”:
Geometric scaling
o Animals are assumed to be scaled up or geometrically similar
versions of one another, whereby shape remains unchanged
as size increases.
o Same as a cube scaling with size
Length increases with slope of 0.33, lengths would scale
as M0.33
Surface are expected to scale as M0.66 (2x0.33)
Volumes are expected to scale as M1 (3x0.33)
A consequence of this scaling law is that musculoskeletal stresses1 are
expected to scale with M0.33. this a result of the mismatch between scaling
of force which an animal experiences to gravity2 and the scaling of cross
sectional area3 of the muscles and bones that are available to resist this
force.
1. α =F / A F = force A = cross-sectional area
2. F ∝ M 1
3. A ∝ M 0.66
Elastic similarity
o Two animals are elastically similar if their support structures
are similarly threatened by elastic failure (Failure of a tissue to
recover to its original size and shape after a load is removed.)
under their own body weight.
Static stress similarity
o Maximum stress (typically bending stress) remains the same
under equivalent conditions and materials, at different sizes.
More in dept in next case
As animals increase in size, they are likely to be composed of more cells,
which requires more energy. But as cells use energy, the also produce heat
which must be lost from the body. After done many studies it was found
, that there is no single universal scaling law relating metabolic rate to
organismal size as organisms can change their metabolic rate not only
over evolutionary time but also over much short time periods to meet the
demands of digestion, reproduction or movement.
Scaling law for metabolic rate: M0.75
Scaling also affects the way in which animals locomote and the
musculoskeletal structures that support and permit movement. As size
increases, there is a mismatch whereby a muscle’s ability to produce force
or a bone’s ability to resist force increases at a slower rate than the
gravitational loads it must bear. Although the mechanical properties of
bones and muscles remain largely unchanged across mammals ranging in
size from <0.05 to 700 kg , terrestrial animals maintain similar relative
stress during locomotion. To mitigate the effects in increasing body size,
there must be alterations in musculoskeletal design, regular changes in
limb posture or a decline in locomotor performance.
Animals scale with elastic similarity to maintain similar elastic
deformations under equivalent loading conditions. Giant animals >1000 kg
defy both of these scaling laws (elastic similarity and static stress
similarity) and tend to have more robust (short/thicker) limb bones which
impacts locomotor function.
If animals scaled geometrically:
Muscle mass would scale with M1.0
Fascicle length would scale with M0.33
Physiological cross-sectional area would scale with M0.66
In contrast to bones and muscles, tendon cross-sectional area scales from
negative allometry to geometric similarity in animal ranging in size from
-.4 to 545 kg. because of the relatively thinner tendons, the ratio of muscle
force to tendon area increases with size such that larger animals and birds
favour elastic energy savings.
Animals of different sizes can also adapt their limb posture to reduce size-
related increases in stress. Small animals move with crouched postures in
which their limbs are flexed while larger animals move with an upright
posture with extended joints. This “uprightness” offers mechanical
benefits allowing larger animals to balance rotational moments at their
limb joints with lower muscle forces than expected for their body size. The
Isometric, surface-volume ratio = 2/3 because:
m2 / m3 = 2/3
1. Definition of isometry and allometry.
2. What are the scaling laws of animal functions (cell size, surface area-
volume ratio)?
3. What is the relation between stroke frequency, wing size and body
size? (lift force/drag force needed to fly (basic understanding))
4. How does heart rate vary with body size? How does ventilation rate
vary with body size? (give examples)
5. How does bone characteristics vary with body size?
6. How does the weight of the organ vary with body size?
7. What to scale for? (body mass, body length, surface area)
8. Provide arguments why or why not the horse can/cannot fly? How
could it be remodelled?
What are the limits for everything (body size, cell size, surface area-
volume)
, 1. Definition of isometry and allometry.
Allometry: how characteristics of living creatures change with size. It
refers to biological scaling relationships in general for morphological traits
(brain vs body size), physiological traits (metabolic rate vs body size) or
ecological traits (wing size vs flight performance). Allometry describes
how traits or processes scale with one another.
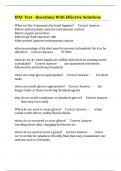
When plotted on a log-log scale scaling relationships could be described
using the simple linear equation:
log y=α∗log x+ log b
x = body size y = organ size log b = intercept of line on
y-axis
alpha = slope of line (allometric coefficient)
When the organ has a higher growth rate than the body alpha > 1
(positive allometry / hyperallometry). When the organ has a lower
growth rate than the body as a whole alpha < 1 which is called negative
allometry or hypoallometry.
When an organ grows at the same are as the rest of the body alpha = 1,
which is called isometry. This organ maintains a constant proportionate
size throughout the development.
Different kinds of allometry:
Ontogenic allometry: x and y are measured in the same individual
through developmental time
o The slope reflects different in growth rate between an organ
and body size
Static allometry: x and y are measured in different individuals at
the same developmental stage within a population or species
o The slope reflects how variation in trait size is accompanied by
variation in body size within a species
Evolutionary allometry: x and y are measured in different species
o The slope reflects how variation in trait size is accompanied by
variation in body size between species
Differences in the intercept (b) of the allometry between species indicates
differences in proportionate size of the wing (in butterflies) irrespective of
,body size. Differences in the slope (alpha) indicates differences in how
relative size of the wing changes with body size within a species.
2. What are the scaling laws of animal functions (cell size,
surface area-volume ratio)?
Most biological systems follow a power curve when plotted an x-y plot
which is why we use a log-log scale to make the understanding easier
since it transforms it to a linear relationship. This can reveal fundamental
patterns which can be explained by a few general scaling “laws”:
Geometric scaling
o Animals are assumed to be scaled up or geometrically similar
versions of one another, whereby shape remains unchanged
as size increases.
o Same as a cube scaling with size
Length increases with slope of 0.33, lengths would scale
as M0.33
Surface are expected to scale as M0.66 (2x0.33)
Volumes are expected to scale as M1 (3x0.33)
A consequence of this scaling law is that musculoskeletal stresses1 are
expected to scale with M0.33. this a result of the mismatch between scaling
of force which an animal experiences to gravity2 and the scaling of cross
sectional area3 of the muscles and bones that are available to resist this
force.
1. α =F / A F = force A = cross-sectional area
2. F ∝ M 1
3. A ∝ M 0.66
Elastic similarity
o Two animals are elastically similar if their support structures
are similarly threatened by elastic failure (Failure of a tissue to
recover to its original size and shape after a load is removed.)
under their own body weight.
Static stress similarity
o Maximum stress (typically bending stress) remains the same
under equivalent conditions and materials, at different sizes.
More in dept in next case
As animals increase in size, they are likely to be composed of more cells,
which requires more energy. But as cells use energy, the also produce heat
which must be lost from the body. After done many studies it was found
, that there is no single universal scaling law relating metabolic rate to
organismal size as organisms can change their metabolic rate not only
over evolutionary time but also over much short time periods to meet the
demands of digestion, reproduction or movement.
Scaling law for metabolic rate: M0.75
Scaling also affects the way in which animals locomote and the
musculoskeletal structures that support and permit movement. As size
increases, there is a mismatch whereby a muscle’s ability to produce force
or a bone’s ability to resist force increases at a slower rate than the
gravitational loads it must bear. Although the mechanical properties of
bones and muscles remain largely unchanged across mammals ranging in
size from <0.05 to 700 kg , terrestrial animals maintain similar relative
stress during locomotion. To mitigate the effects in increasing body size,
there must be alterations in musculoskeletal design, regular changes in
limb posture or a decline in locomotor performance.
Animals scale with elastic similarity to maintain similar elastic
deformations under equivalent loading conditions. Giant animals >1000 kg
defy both of these scaling laws (elastic similarity and static stress
similarity) and tend to have more robust (short/thicker) limb bones which
impacts locomotor function.
If animals scaled geometrically:
Muscle mass would scale with M1.0
Fascicle length would scale with M0.33
Physiological cross-sectional area would scale with M0.66
In contrast to bones and muscles, tendon cross-sectional area scales from
negative allometry to geometric similarity in animal ranging in size from
-.4 to 545 kg. because of the relatively thinner tendons, the ratio of muscle
force to tendon area increases with size such that larger animals and birds
favour elastic energy savings.
Animals of different sizes can also adapt their limb posture to reduce size-
related increases in stress. Small animals move with crouched postures in
which their limbs are flexed while larger animals move with an upright
posture with extended joints. This “uprightness” offers mechanical
benefits allowing larger animals to balance rotational moments at their
limb joints with lower muscle forces than expected for their body size. The