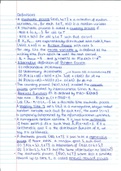
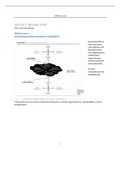
Statistics Theory
Different types of statistics
Univariate
Bivariate
Multivariate
Descriptive
o Summarize a specific data set
o Broken down into measures of tendency and measures of variability
Inferential
o Random sample to describe and make inferences about the population
Inference
A conclusion reached on the basis of evidence and reasoning
Unit of analysis
The what or who is being studied
Unit you draw conclusions about
Typically all units are the same type of thing in a single data set
Individuals, families, countries,…
Variable
Measured property of each of the units of analysis
Age, GDP, household income ….
Level of measurement
Nominal
o Group classifications
o No meaningful ranking possible
o Numerical coding arbitrary
Ordinal
o Meaningful ranking / ordering
o Distance between categories is unknown / not equal
Interval
o Meaningful ranking
o Distances are equal
o No true zero point
Ratio
o All properties of interval (ranking & equal distances)
o Absolute & meaningful zero point
Note: Need to know the level of measurement first in order to know which statistical
techniques to use for the given variable(s)
Continuous vs discrete variables
Continuous variable
o Measured along a continuum
Discrete variable
, o Measured in whole units or categories
Measures of central tendency
Mean
o Interval / ratio
o All values added up and divided by n (number of observations in the sample)
o Changing any score will change mean
o Adding or removing a score will change mean (unless that score is already
equal to the mean)
o Adding, subtracting, multiplying, diving each score by a given value causes the
mean to change accordingly
o Sum of differences from the mean is zero
o Sum of squared differences from the mean is minimal
Sum of Squares
o Squared distance from the mean
o A larger SS means that scores deviate more from the mean
Median
o Ordinal & interval / ratio
o To find the median
Sort all cases based on their value on x
The value of the “middle case” equals the median (equal amount of
cases below and above)
o n is an even number -> median is mean value of the two middle cases
o not that sensitive to outliers as the mean
mode
o nominal, ordinal, interval / ratio)
o mode is the category with the largest amount of cases
Measures of variability
range
o ordinal, interval / ratio
o distance between highest and lowest score
o always reported together with maximum and minimum score
o sensitive to outliers
Interquartile range (IQR)
o Ordinal, interval / ratio
o Based on “quartiles” that split our data into four equal groups of cases
o IQR based on distance between Q1 and Q3
Measures of variability
Variance
o Interval / ratio
o Based on the sum of Squares
o For the calculation of variance, it matters whether we have sample data or
population data