0HM120 – Advanced Data Analysis
Complete file STATA commands
Content
Useful commands
Overview: Link research question to a certain test
Lecture 1: Descriptive and inferential statistics
Lecture 2: Introduction to ANOVA
Lecture 3: Repeated and mixed ANOVA
Lecture 4: Introduction to regression
Lecture 5: Moderated regression
Lecture 6: Introduction to ANCOVA
Lecture 7: Advanced topics in ANCOVA
Lecture 8: Introduction to contrast analysis
Lecture 9: Contrast analysis
Lecture 10: Mediation analysis
Lecture 11: Moderated mediation analysis
Lecture 12: Meta analytical thinking
,Useful commands
Starting your do-file
clear
set more off
use “location” --> Tells Stata which dataset to use
renvarlab _all, lower --> replace all uppercase letters by lowercase letters
graph drop _all --> removes earlier created graphs, so you can re-run your do-file
without errors
Useful codes
rename oldname newname
Install new code:
ssc install newcode, replace
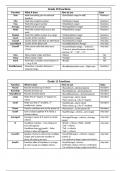
Understanding your data
Most important commands
renvarlab _all, lower Use the following code to change all uppercase letters to lowercase in
variable names
tab variable provides frequencies for that certain variable
codebook variable How are they coded: this gives the labels for the categories of the
country variable, and the frequencies (incl any missing values)
summarize variable Shows the obs, max, min, mean and Std. Dev.
count if variable >=. Counts missing values, however coded (., .a, .b etc.). the >=. seems odd,
but note that STATA treats missing values as very high values
table variable1, c(n variable2 mean variable2 sd variable2) To calculate the mean, N and sd per
category (variable1) c stands for content
of the cell
gene odd=mod(id,2) This separates the odd and even numbers
Alternatively one can use:
tab country, m the m provides frequencies for missing labels as well
or
list id country indiv if indiv >=. Lists the id, country of origin, and missing value code of each person
with a missing value. (you know what person did not fill in something)
*to exclude the ID with missing value on country (we do not need it for this exercise and it
complicates the use of the by command introduced later
drop if country >=.
Drop p75 iqrange extr_indiv drop if you no longer need a variable
~= Not equal to (to exclude outliers)
,Example page for Stuvia preview (part of lecture 2)
Testing the normal distribution with Skewness and kurtosis
Skewness: Is there asymmetry of the distribution? A normal distribution is symmetric: Skewness= 0
Kurtosis: Peakness of a distribution. a normal distribution is mesokurtic: Kurtosis = 3
sum variable, detail --> provides detailed summaries including skewness and kurtosis
Skewness-Kurtosis test
(provides the p-value associated with the skewness statistic)
sktest indiv if country==1
sktest indiv if country==2
Shapiro-Wilk test
Uses W-statistic (based on the correlation between observed scores and those expected
from a normal distribution.
H0: sampled from a normally distributed population (W = 1)
H1: not sampled from a normally distributed population (W ≠ 1)
swilk indiv if country==1
swilk indiv if country==2
OR
bysort country: swilk indiv
If W ≥ .97 (as a rule of thumb) the data is normally distributed
And if P > 0.05 the data is normally distributed
1. Dealing with data that is not normally distributed
ladder variable --> look for which transformation p > 0.05
ladder variable1 if variable2==0 and ladder variable1 if variable2==1 --> look for transformations for
the two groups within the variable separately
gen variable_trans = sqrt(variable) --> do the transformation, for example square root (sqrt)
B. Look for outliers
Use the z-score method:
Step 1. Standardize the variables
egen zindiv_spain = std(indiv) if country==1
egen zindiv_india = std(indiv) if country==2
etc.
, Overview: link research question to a certain test
Comparing your sample to a number.
e.g. Is the average height of adult Dutch males 173 cm?
one sample t-test
Comparing two means with each other
e.g. Do people who get drug A recover faster than people who get drug B?
independent samples t-test
Does independent variable X affect dependent variable Y? (causation) Answer questions about
differences between groups, or the effect of the factors that define group membership.
e.g. does manipulation of seating location affect educational performance?
Group membership is defined by a single factor.
one-way between subjects ANOVA
Each participant is a member of all groups (all group consist of the same participants)
one-way within subjects (repeated measures) ANOVA
Do independent variable X1 and independent variable X2 influence dependent variable Y?
e.g. How do exercise (2 categories) and medication (3 categories) affect weight loss? 2x3 design with
first order interactions. If you have a 2x2x3 design, you also have second order interactions.
Group membership is defined by multiple factors.
factorial between subjects ANOVA (two-way ANOVA)
Each participant is a member of all groups (all group consist of the same participants)
factorial within subjects (repeated measures) ANOVA
When participants are member of some of the groups. Both between measurements and
within (repeated measurements)
Mixed ANOVA
Predicting (estimate) dependent variable Y by means of (on the basis of) a single predictor X. How is X
related to Y?
Simple regression
Predicting dependent variable Y by means of predictor X1 and predictor X2. (more than one
predictor)
multiple regression
What is the correlation between variable X1 and variable Y when the variation in Y due to variable X 2
is removed?
Partial correlation
What is the correlation between variable X1 and variable Y when the variation in Y due to variable X 2
is ignored? What is the unique contributesion of X 1 to the explanation of variance in Y?
semipartial (part) correlation
Complete file STATA commands
Content
Useful commands
Overview: Link research question to a certain test
Lecture 1: Descriptive and inferential statistics
Lecture 2: Introduction to ANOVA
Lecture 3: Repeated and mixed ANOVA
Lecture 4: Introduction to regression
Lecture 5: Moderated regression
Lecture 6: Introduction to ANCOVA
Lecture 7: Advanced topics in ANCOVA
Lecture 8: Introduction to contrast analysis
Lecture 9: Contrast analysis
Lecture 10: Mediation analysis
Lecture 11: Moderated mediation analysis
Lecture 12: Meta analytical thinking
,Useful commands
Starting your do-file
clear
set more off
use “location” --> Tells Stata which dataset to use
renvarlab _all, lower --> replace all uppercase letters by lowercase letters
graph drop _all --> removes earlier created graphs, so you can re-run your do-file
without errors
Useful codes
rename oldname newname
Install new code:
ssc install newcode, replace
Understanding your data
Most important commands
renvarlab _all, lower Use the following code to change all uppercase letters to lowercase in
variable names
tab variable provides frequencies for that certain variable
codebook variable How are they coded: this gives the labels for the categories of the
country variable, and the frequencies (incl any missing values)
summarize variable Shows the obs, max, min, mean and Std. Dev.
count if variable >=. Counts missing values, however coded (., .a, .b etc.). the >=. seems odd,
but note that STATA treats missing values as very high values
table variable1, c(n variable2 mean variable2 sd variable2) To calculate the mean, N and sd per
category (variable1) c stands for content
of the cell
gene odd=mod(id,2) This separates the odd and even numbers
Alternatively one can use:
tab country, m the m provides frequencies for missing labels as well
or
list id country indiv if indiv >=. Lists the id, country of origin, and missing value code of each person
with a missing value. (you know what person did not fill in something)
*to exclude the ID with missing value on country (we do not need it for this exercise and it
complicates the use of the by command introduced later
drop if country >=.
Drop p75 iqrange extr_indiv drop if you no longer need a variable
~= Not equal to (to exclude outliers)
,Example page for Stuvia preview (part of lecture 2)
Testing the normal distribution with Skewness and kurtosis
Skewness: Is there asymmetry of the distribution? A normal distribution is symmetric: Skewness= 0
Kurtosis: Peakness of a distribution. a normal distribution is mesokurtic: Kurtosis = 3
sum variable, detail --> provides detailed summaries including skewness and kurtosis
Skewness-Kurtosis test
(provides the p-value associated with the skewness statistic)
sktest indiv if country==1
sktest indiv if country==2
Shapiro-Wilk test
Uses W-statistic (based on the correlation between observed scores and those expected
from a normal distribution.
H0: sampled from a normally distributed population (W = 1)
H1: not sampled from a normally distributed population (W ≠ 1)
swilk indiv if country==1
swilk indiv if country==2
OR
bysort country: swilk indiv
If W ≥ .97 (as a rule of thumb) the data is normally distributed
And if P > 0.05 the data is normally distributed
1. Dealing with data that is not normally distributed
ladder variable --> look for which transformation p > 0.05
ladder variable1 if variable2==0 and ladder variable1 if variable2==1 --> look for transformations for
the two groups within the variable separately
gen variable_trans = sqrt(variable) --> do the transformation, for example square root (sqrt)
B. Look for outliers
Use the z-score method:
Step 1. Standardize the variables
egen zindiv_spain = std(indiv) if country==1
egen zindiv_india = std(indiv) if country==2
etc.
, Overview: link research question to a certain test
Comparing your sample to a number.
e.g. Is the average height of adult Dutch males 173 cm?
one sample t-test
Comparing two means with each other
e.g. Do people who get drug A recover faster than people who get drug B?
independent samples t-test
Does independent variable X affect dependent variable Y? (causation) Answer questions about
differences between groups, or the effect of the factors that define group membership.
e.g. does manipulation of seating location affect educational performance?
Group membership is defined by a single factor.
one-way between subjects ANOVA
Each participant is a member of all groups (all group consist of the same participants)
one-way within subjects (repeated measures) ANOVA
Do independent variable X1 and independent variable X2 influence dependent variable Y?
e.g. How do exercise (2 categories) and medication (3 categories) affect weight loss? 2x3 design with
first order interactions. If you have a 2x2x3 design, you also have second order interactions.
Group membership is defined by multiple factors.
factorial between subjects ANOVA (two-way ANOVA)
Each participant is a member of all groups (all group consist of the same participants)
factorial within subjects (repeated measures) ANOVA
When participants are member of some of the groups. Both between measurements and
within (repeated measurements)
Mixed ANOVA
Predicting (estimate) dependent variable Y by means of (on the basis of) a single predictor X. How is X
related to Y?
Simple regression
Predicting dependent variable Y by means of predictor X1 and predictor X2. (more than one
predictor)
multiple regression
What is the correlation between variable X1 and variable Y when the variation in Y due to variable X 2
is removed?
Partial correlation
What is the correlation between variable X1 and variable Y when the variation in Y due to variable X 2
is ignored? What is the unique contributesion of X 1 to the explanation of variance in Y?
semipartial (part) correlation