Table of Contents
Summary practical PPT data mining .............................................................................................. 3
Practical 1: Data import/export, data types and manipulation......................................................... 3
1. Introduction to R ..................................................................................................................... 3
1.1. A typical R-command ...................................................................................................... 3
1.2. R-studio .......................................................................................................................... 3
2. Data import, export and manipulation ...................................................................................... 4
2.1. Importing and exporting data ........................................................................................... 4
2.2. Types of data ................................................................................................................... 4
2.3. Indexing and selection ..................................................................................................... 5
3. Plotting in R ............................................................................................................................. 6
Practical 2: Statistical analysis is R ............................................................................................... 7
1. Independent sample t-test....................................................................................................... 7
2. Parametric testing and normality.............................................................................................. 7
2.1. Are my data normal enough? ............................................................................................ 7
2.2. Formal test of normality ................................................................................................... 7
3. Simple linear regression .......................................................................................................... 8
3.1. Numeric linear regression ................................................................................................ 8
3.2. Analysis in R .................................................................................................................... 9
4. Analysis of variance ................................................................................................................ 9
4.1. Dummy coding ................................................................................................................ 9
4.2. ANOVA model ................................................................................................................. 9
4.3. Dummy variable ............................................................................................................ 10
4.4. Interpretation of coeLicients .......................................................................................... 10
4.5. Inference in ANOVA ....................................................................................................... 10
4.6. Analysis in R .................................................................................................................. 10
Practical 3: Automation, add-on packages and reshaping .............................................................. 11
1. Automation of repetitive analyses ...........................................................................................11
1.1. Repetitive analysis......................................................................................................... 11
1.2. For-loop ........................................................................................................................ 11
1.3. Automation with new function........................................................................................ 12
1.4. Combine list and for-loop .............................................................................................. 13
2. Add-on packages ...................................................................................................................13
2.1. Base package ................................................................................................................ 13
2.2. Package installation ...................................................................................................... 13
2.3. Activate a package......................................................................................................... 14
3. Reshaping data ......................................................................................................................14
3.1. Data reshaping .............................................................................................................. 14
3.2. Aggregation ................................................................................................................... 14
Principal 4: component analysis and cluster analysis.................................................................... 15
1. Principal Components analysis ..............................................................................................15
1.1. Multidimensional data ................................................................................................... 15
1.2. Principal Component analysis........................................................................................ 15
1
, 2. Cluster analysis .....................................................................................................................16
Practical 5: Multiple linear regression and linear mixed models ..................................................... 17
1. Multiple linear regression........................................................................................................17
1.1. Example 1 ..................................................................................................................... 17
1.2. Categorical covariates ................................................................................................... 17
1.3. Inference on ANCOVA model ......................................................................................... 17
1.4. Main eLects vs interactions ........................................................................................... 18
1.5. Modelling interactions ................................................................................................... 18
1.6. ANCOVA with interaction ............................................................................................... 18
1.7. Graphical interpretation ................................................................................................. 18
1.8. Stepwise backward model building ................................................................................ 19
1.9. Stepwise model building ................................................................................................ 19
1.10. Analysis in R .............................................................................................................. 19
1.11. Further ..................................................................................................................... 20
2. Linear mixed models for analysis of non-independent data ......................................................20
2.1. Non-independent data................................................................................................... 20
2.2. Examples ...................................................................................................................... 20
2.3. Analysis clustered data .................................................................................................. 21
2.4. Clustered data .............................................................................................................. 21
2.5. Linear mixed model ....................................................................................................... 23
2.6. Intraclass coeLicient (ICC)............................................................................................. 23
2.7. More advanced linear mixed models .............................................................................. 23
2.8. Linear mixed models in R ............................................................................................... 24
2
, Summary practical PPT data mining
Practical 1: Data import/export, data types and
manipulation
1. Introduction to R
1.1. A typical R-command
- Seq = sequency
o A func1on that generates a sequence of numbers à a vector
- Vector = one dimensional matrix (column or row)
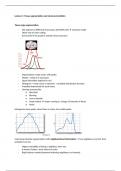
1.2. R-studio
- Script: add commands, save for later use
- Prompt: here you can directly type in commands at the
prompt. Easy for a quick check or calcula1on that you
don’t want to include into the code
- Work space: all objects that are stored in the R memory
- Various: here you can find your graphs but also some
more explana1on
o If you type ‘?seq’ in prompt, you see the
explana1on in various
- Assignments
o Getwd(): to get your current WD
o Setwd(“C:\temp\...”): change WD
o List.files(getwd()): shows files in current WD
o Read.table(“myInput.txt”)
o Write.table(“myOutput.txt”)
3
, 2. Data import, export and manipulation
2.1. Impor7ng and expor7ng data
- Read-in func1on
o Read.table(file, header = FALSE, sep = "", quote = "\"'", dec = ".", row.names,
col.names, as.is = !stringsAsFactors, na.strings = "NA", colClasses = NA, nrows = -1,
skip = 0, check.names = TRUE, fill = !blank.lines.skip, strip.white = FALSE,
blank.lines.skip = TRUE, comment.char = "#", allowEscapes = FALSE, flush = FALSE,
stringsAsFactors = default.stringsAsFactors(), encoding = "unknown")
§ File = name of the file
§ Header = is there a first line containing the names of the variables. R tells we
need to supply a logical (means you need to tell true or false)
§ Sep = field separater, which character is used to separate the columns
§ Dec = character used for decimal points, the default seeng in R is “.”. If your
file has “.”, you don’t need to supply this argument
§ Na.string = missing value indicator, default is NA, of missing value is NA, you
don’t need this argument, but if it is “?” you need this
§ StringsAsFactors = TRUE if variables are read in as factors
- Things to avoid
o Header line
§ ‘special’ characters in headers (# - &%$?@;-)
§ Columns not having header
o Cells with formula
§ Copy, PasteSpecial, Values
o Empty cells
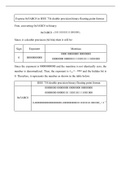
- Expor1ng a dataset
o Write.table(x, file = "", append = FALSE, quote = TRUE, sep = " ", eol = "\n", na = "NA",
dec = ".", row.names = TRUE, col.names = TRUE, qmethod = c("escape", "double"))
§ Quote = TRUE if a set is true, factors will be surrounded by “” à don’t want
that so quote = FALSE
§ Sep = the field separator, we don’t want white space, we want a tap à
sep=”/t”
§ Row.names = TRUE: a logical that indicate whether the row names of the
data frame are to be wrinen along with x, this means that the row names are
exported with the rest of the table
2.2. Types of data
- 4 main types (or classes) of variables
o Numeric: integer or floa1ng point
o Character: text string
o Factor: categorical variable with limited number of levels, Ordered or not
o Logical: TRUE or FALSE
- Convert data types - coercion
o as.numeric()
o as.character()
o as.logical()
o as.factor()
- Func1ons can operate differently according to data type
o ANOVA vs. regression
4
Summary practical PPT data mining .............................................................................................. 3
Practical 1: Data import/export, data types and manipulation......................................................... 3
1. Introduction to R ..................................................................................................................... 3
1.1. A typical R-command ...................................................................................................... 3
1.2. R-studio .......................................................................................................................... 3
2. Data import, export and manipulation ...................................................................................... 4
2.1. Importing and exporting data ........................................................................................... 4
2.2. Types of data ................................................................................................................... 4
2.3. Indexing and selection ..................................................................................................... 5
3. Plotting in R ............................................................................................................................. 6
Practical 2: Statistical analysis is R ............................................................................................... 7
1. Independent sample t-test....................................................................................................... 7
2. Parametric testing and normality.............................................................................................. 7
2.1. Are my data normal enough? ............................................................................................ 7
2.2. Formal test of normality ................................................................................................... 7
3. Simple linear regression .......................................................................................................... 8
3.1. Numeric linear regression ................................................................................................ 8
3.2. Analysis in R .................................................................................................................... 9
4. Analysis of variance ................................................................................................................ 9
4.1. Dummy coding ................................................................................................................ 9
4.2. ANOVA model ................................................................................................................. 9
4.3. Dummy variable ............................................................................................................ 10
4.4. Interpretation of coeLicients .......................................................................................... 10
4.5. Inference in ANOVA ....................................................................................................... 10
4.6. Analysis in R .................................................................................................................. 10
Practical 3: Automation, add-on packages and reshaping .............................................................. 11
1. Automation of repetitive analyses ...........................................................................................11
1.1. Repetitive analysis......................................................................................................... 11
1.2. For-loop ........................................................................................................................ 11
1.3. Automation with new function........................................................................................ 12
1.4. Combine list and for-loop .............................................................................................. 13
2. Add-on packages ...................................................................................................................13
2.1. Base package ................................................................................................................ 13
2.2. Package installation ...................................................................................................... 13
2.3. Activate a package......................................................................................................... 14
3. Reshaping data ......................................................................................................................14
3.1. Data reshaping .............................................................................................................. 14
3.2. Aggregation ................................................................................................................... 14
Principal 4: component analysis and cluster analysis.................................................................... 15
1. Principal Components analysis ..............................................................................................15
1.1. Multidimensional data ................................................................................................... 15
1.2. Principal Component analysis........................................................................................ 15
1
, 2. Cluster analysis .....................................................................................................................16
Practical 5: Multiple linear regression and linear mixed models ..................................................... 17
1. Multiple linear regression........................................................................................................17
1.1. Example 1 ..................................................................................................................... 17
1.2. Categorical covariates ................................................................................................... 17
1.3. Inference on ANCOVA model ......................................................................................... 17
1.4. Main eLects vs interactions ........................................................................................... 18
1.5. Modelling interactions ................................................................................................... 18
1.6. ANCOVA with interaction ............................................................................................... 18
1.7. Graphical interpretation ................................................................................................. 18
1.8. Stepwise backward model building ................................................................................ 19
1.9. Stepwise model building ................................................................................................ 19
1.10. Analysis in R .............................................................................................................. 19
1.11. Further ..................................................................................................................... 20
2. Linear mixed models for analysis of non-independent data ......................................................20
2.1. Non-independent data................................................................................................... 20
2.2. Examples ...................................................................................................................... 20
2.3. Analysis clustered data .................................................................................................. 21
2.4. Clustered data .............................................................................................................. 21
2.5. Linear mixed model ....................................................................................................... 23
2.6. Intraclass coeLicient (ICC)............................................................................................. 23
2.7. More advanced linear mixed models .............................................................................. 23
2.8. Linear mixed models in R ............................................................................................... 24
2
, Summary practical PPT data mining
Practical 1: Data import/export, data types and
manipulation
1. Introduction to R
1.1. A typical R-command
- Seq = sequency
o A func1on that generates a sequence of numbers à a vector
- Vector = one dimensional matrix (column or row)
1.2. R-studio
- Script: add commands, save for later use
- Prompt: here you can directly type in commands at the
prompt. Easy for a quick check or calcula1on that you
don’t want to include into the code
- Work space: all objects that are stored in the R memory
- Various: here you can find your graphs but also some
more explana1on
o If you type ‘?seq’ in prompt, you see the
explana1on in various
- Assignments
o Getwd(): to get your current WD
o Setwd(“C:\temp\...”): change WD
o List.files(getwd()): shows files in current WD
o Read.table(“myInput.txt”)
o Write.table(“myOutput.txt”)
3
, 2. Data import, export and manipulation
2.1. Impor7ng and expor7ng data
- Read-in func1on
o Read.table(file, header = FALSE, sep = "", quote = "\"'", dec = ".", row.names,
col.names, as.is = !stringsAsFactors, na.strings = "NA", colClasses = NA, nrows = -1,
skip = 0, check.names = TRUE, fill = !blank.lines.skip, strip.white = FALSE,
blank.lines.skip = TRUE, comment.char = "#", allowEscapes = FALSE, flush = FALSE,
stringsAsFactors = default.stringsAsFactors(), encoding = "unknown")
§ File = name of the file
§ Header = is there a first line containing the names of the variables. R tells we
need to supply a logical (means you need to tell true or false)
§ Sep = field separater, which character is used to separate the columns
§ Dec = character used for decimal points, the default seeng in R is “.”. If your
file has “.”, you don’t need to supply this argument
§ Na.string = missing value indicator, default is NA, of missing value is NA, you
don’t need this argument, but if it is “?” you need this
§ StringsAsFactors = TRUE if variables are read in as factors
- Things to avoid
o Header line
§ ‘special’ characters in headers (# - &%$?@;-)
§ Columns not having header
o Cells with formula
§ Copy, PasteSpecial, Values
o Empty cells
- Expor1ng a dataset
o Write.table(x, file = "", append = FALSE, quote = TRUE, sep = " ", eol = "\n", na = "NA",
dec = ".", row.names = TRUE, col.names = TRUE, qmethod = c("escape", "double"))
§ Quote = TRUE if a set is true, factors will be surrounded by “” à don’t want
that so quote = FALSE
§ Sep = the field separator, we don’t want white space, we want a tap à
sep=”/t”
§ Row.names = TRUE: a logical that indicate whether the row names of the
data frame are to be wrinen along with x, this means that the row names are
exported with the rest of the table
2.2. Types of data
- 4 main types (or classes) of variables
o Numeric: integer or floa1ng point
o Character: text string
o Factor: categorical variable with limited number of levels, Ordered or not
o Logical: TRUE or FALSE
- Convert data types - coercion
o as.numeric()
o as.character()
o as.logical()
o as.factor()
- Func1ons can operate differently according to data type
o ANOVA vs. regression
4