Colorimetry report/cooling curves
Cooling curves graph shows the change of state of a substance cooling from a liquid to a solid
We have done two experiments calibrating thermometers and cooling curves in which stearic
acid and paraffin wax was used and the aim was to find out.
- To find out accuracy of thermometers and see which one works better
- To study the cooling curve of paraffin wax and the cooling curve of stearic acid and find
out its rate of cooling
Calibrating thermometers – two thermometers were used blue alcohol thermometer and digital
thermometer which were calibrated in frozen water and boiling water
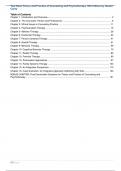
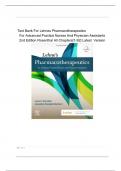
Practical pictures for evidence
, equipment's for calibrating thermometers
- Freshly boiled water in a kettle
- Ice cubes
- Timer to calculate the temperature after each interval
- Thermometers in this case digital thermometer and blue alcohol thermometer was used
- Beakers which are 200cm cube for boiling water and iced water
Methods
Using ice water
- Pour ice into a beaker the temperature should be zero Celsius which means you need to use
cold ice
- Stir the water when ice is added and leave it for 2 to 3 minutes
- Stir the ice again and place the two thermometers inside the cold water
- Decide an interval e.g., after 1 min or 30 sec I used an interval for 1 min after 1 min the readings
were recorded and this process was repeated for 17 minutes
- After each interval use a timer in this case so the results are accurate, and the intervals are same
- After 3 minutes the reading should be zero degrees which means the thermometers have
- calibrated and this reading was recorded of results and the thermometers are offset
Using boiled water
- Using a kettle boil water
- Freshly boiled water is poured into the beaker
Cooling curves graph shows the change of state of a substance cooling from a liquid to a solid
We have done two experiments calibrating thermometers and cooling curves in which stearic
acid and paraffin wax was used and the aim was to find out.
- To find out accuracy of thermometers and see which one works better
- To study the cooling curve of paraffin wax and the cooling curve of stearic acid and find
out its rate of cooling
Calibrating thermometers – two thermometers were used blue alcohol thermometer and digital
thermometer which were calibrated in frozen water and boiling water
Practical pictures for evidence
, equipment's for calibrating thermometers
- Freshly boiled water in a kettle
- Ice cubes
- Timer to calculate the temperature after each interval
- Thermometers in this case digital thermometer and blue alcohol thermometer was used
- Beakers which are 200cm cube for boiling water and iced water
Methods
Using ice water
- Pour ice into a beaker the temperature should be zero Celsius which means you need to use
cold ice
- Stir the water when ice is added and leave it for 2 to 3 minutes
- Stir the ice again and place the two thermometers inside the cold water
- Decide an interval e.g., after 1 min or 30 sec I used an interval for 1 min after 1 min the readings
were recorded and this process was repeated for 17 minutes
- After each interval use a timer in this case so the results are accurate, and the intervals are same
- After 3 minutes the reading should be zero degrees which means the thermometers have
- calibrated and this reading was recorded of results and the thermometers are offset
Using boiled water
- Using a kettle boil water
- Freshly boiled water is poured into the beaker