Variance-Covariance Matrix
This lesson explains how to use matrix methods to generate a variance-covariance matrix from a matrix of raw data.
Variance
Variance is a measure of the variability or spread in a set of data. Mathematically, it is the average squared deviation from the mean
score. We use the following formula to compute population variance.
Var(X) = Σ ( Xi - X )2 / N = Σ xi2 / N
where
N is the number of scores in a set of scores
X is the mean of the N scores.
Xi is the ith raw score in the set of scores
xi is the ith deviation score in the set of scores
Var(X) is the variance of all the scores in the set
Covariance
Covariance is a measure of the extent to which corresponding elements from two sets of ordered data move in the same direction. We
use the following formula to compute population covariance.
Cov(X, Y) = Σ ( Xi - X ) ( Yi - Y ) / N = Σ xiyi / N
where
N is the number of scores in each set of data
X is the mean of the N scores in the first dataset
Xi is the ithe raw score in the first set of scores
xi is the ith deviation score in the first set of scores
Y is the mean of the N scores in the second dataset
Yi is the ithe raw score in the second set of scores
yi is the ith deviation score in the second set of scores
Cov(X, Y) is the covariance of corresponding scores in the two sets of data
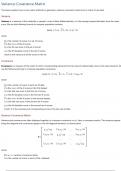
Variance-Covariance Matrix
Variance and covariance are often displayed together in a variance-covariance matrix, (aka, a covariance matrix). The variances appear
along the diagonal and covariances appear in the off-diagonal elements, as shown below.
Σ x12 / N Σ x1 x2 / N ... Σ x1 xc / N
Σ x2 x1 / N Σ x22 / N ... Σ x2 xc / N
V=
... ... ... ...
Σ xc x1 / N Σ xc x2 / N ... Σ x c2 / N
where
V is a c x c variance-covariance matrix
N is the number of scores in each of the c datasets
This lesson explains how to use matrix methods to generate a variance-covariance matrix from a matrix of raw data.
Variance
Variance is a measure of the variability or spread in a set of data. Mathematically, it is the average squared deviation from the mean
score. We use the following formula to compute population variance.
Var(X) = Σ ( Xi - X )2 / N = Σ xi2 / N
where
N is the number of scores in a set of scores
X is the mean of the N scores.
Xi is the ith raw score in the set of scores
xi is the ith deviation score in the set of scores
Var(X) is the variance of all the scores in the set
Covariance
Covariance is a measure of the extent to which corresponding elements from two sets of ordered data move in the same direction. We
use the following formula to compute population covariance.
Cov(X, Y) = Σ ( Xi - X ) ( Yi - Y ) / N = Σ xiyi / N
where
N is the number of scores in each set of data
X is the mean of the N scores in the first dataset
Xi is the ithe raw score in the first set of scores
xi is the ith deviation score in the first set of scores
Y is the mean of the N scores in the second dataset
Yi is the ithe raw score in the second set of scores
yi is the ith deviation score in the second set of scores
Cov(X, Y) is the covariance of corresponding scores in the two sets of data
Variance-Covariance Matrix
Variance and covariance are often displayed together in a variance-covariance matrix, (aka, a covariance matrix). The variances appear
along the diagonal and covariances appear in the off-diagonal elements, as shown below.
Σ x12 / N Σ x1 x2 / N ... Σ x1 xc / N
Σ x2 x1 / N Σ x22 / N ... Σ x2 xc / N
V=
... ... ... ...
Σ xc x1 / N Σ xc x2 / N ... Σ x c2 / N
where
V is a c x c variance-covariance matrix
N is the number of scores in each of the c datasets