Comparing Box Plots Quiz 100%
Save
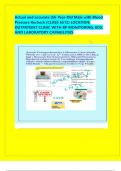
The box plots show the weights, in pounds, of the dogs in two different animal shelters.Weights of Dogs in
Shelter A Weights of Dogs in Shelter B . Which animal shelter has the dog that weighs the greatest? shelter A
shelter B Both shelters have a dog with the highest weight of 28 pounds. Both shelters have a dog with the
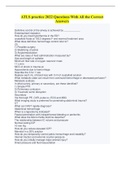
highest weight of 30 pounds. correct answer A. shelter A The box plots show the average speeds, in miles per
hour, for the race cars in two different races. Average Speeds of Cars in Race A Average Speeds of Cars in
Race B Which statement compares the median speeds for the data in the two box plots? The median speed in
race A is about 142 miles per hour, and the median speed in race B is about 140 miles per hour. The median
speed in race A is about 120 miles per hour, and the median speed in race B is about 125 miles per hour. The
median speed in both races is about 165 miles per hour. The median speed in race A is about 153 miles per
hour, and the median speed in race B is about 145 miles per hour. correct answer D. The median speed in race
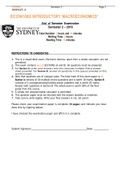
A is about 153 miles per hour, and the median speed in race B is about 145 miles per hour. The box plots show
Lauren's chemistry scores and her biology scores. Lauren used the steps below to determine the differences
in the medians and the interquartile ranges. Lauren determined that the difference in the medians is greater
than the difference in the interquartile ranges. Which explains Lauren's error? Lauren made her first error in
step 1 because the median is 85 for chemistry and 80 for biology. Lauren made her first error in step 1 because
the median is 60 for chemistry and 60 for biology. Lauren made her first error in step 3 because she should
have used for chemistry and for biology. Lauren made her first error in step 3 because she should have used
for chemistry and for biology. correct answer D. Lauren made her first error in step 3 because she should
have used for chemistry and for biology. The box plots show the summer temperatures, in degrees
Fahrenheit, in two cities. Linda is trying to decide which city to visit. She likes the summer temperature to be
around . Which city she should visit? She should visit city A because the temperatures are consistently closer
to a median of . She should visit city B because the temperatures are consistently closer to a median of . It
doesn't matter which city she visits because both medians are from . It doesn't matter which city she visits
because it will likely reach in both cities. correct answer B. She should visit city B because the temperatures
are consistently closer to a median of . The box plots show the average gas mileage of cars and minivans
tested by a certain company. Josef says that the range for the car data is greater than the range for the
minivan data because the box in the box plot for the car data is wider. Which explains Josef's error? Josef
confused the range and the interquartile range. Josef confused the range and the median. Josef should have
compared the medians and minimum values. Josef should have compared the medians and maximum values.
correct answer A. Josef confused the range and the interquartile range. The box plots show the average wind
speeds, in miles per hour, for various cities in two different countries. Which statement compares the median
wind speeds for the data in the two box plots? The median wind speed for country A is greater than the
median wind speed for country B. The median wind speed for country B is greater than the median wind
speed for country A. The median wind speed for country A is about 7 miles per hour, and the median wind
speed for country B is about 9 miles per hour. The median wind speed for each country is about 4 miles per
hour. correct answer B. The median wind speed for country B is greater than the median wind speed for
country A. The box plots show the average gas mileage, in miles per gallon, of cars and minivans tested by a
certain company. Which correctly compares the interquartile ranges? The interquartile range for cars is about
12 mpg, and the interquartile range for minivans is about 12 mpg. The interquartile range for cars is about 7
mpg, and the interquartile range for minivans is about 3 mpg. The interquartile range for cars is about 24 mpg,
and the interquartile range for minivans is about 19 mpg. The interquartile range for cars is about 8 mpg, and
the interquartile range for minivans is about 7 mpg. correct answer B. The interquartile range for cars is about
7 mpg, and the interquartile range for minivans is about 3 mpg. The box plots show the weights, in pounds, of
the dogs in two different animal shelters.Weights of Dogs in Shelter A Weights of Dogs in Shelter B Which
animal shelter has the dog that weighs the least? shelter A shelter B Both shelters have a dog with the lowest
weight of 8 pounds. Both shelters have a dog with the lowest weight of 10 pounds. correct answer A. shelter
A The box plots show the number of hours of television a group of middle school students and a group of
elementary school students watch each week.Middle School Students Elementary School Students Which are
true statements when comparing the data in the box plots? Select three choices. The data for elementary
school are more consistent than those for middle school. More of the data for middle school lie closer to the
median than the data for elementary school. About 50% of elementary school students watch between 4 and
7 hours of television each week. About one-half of middle school students watch less than 2 hours of
television each week. On average, middle school students watch less television than elementary school
students each week. correct answer A, C, E - The data for elementary school are more consistent than those
for middle school. - More of the data for middle school lie closer to the median than the data for elementary
school. - On average, middle school students watch less television than elementary school students each
week. The box plots show Rene's scores in Spanish and in French. Which table correctly compares the
measures of center and the measures of variability? correct answerD.
Save
The box plots show the weights, in pounds, of the dogs in two different animal shelters.Weights of Dogs in
Shelter A Weights of Dogs in Shelter B . Which animal shelter has the dog that weighs the greatest? shelter A
shelter B Both shelters have a dog with the highest weight of 28 pounds. Both shelters have a dog with the
highest weight of 30 pounds. correct answer A. shelter A The box plots show the average speeds, in miles per
hour, for the race cars in two different races. Average Speeds of Cars in Race A Average Speeds of Cars in
Race B Which statement compares the median speeds for the data in the two box plots? The median speed in
race A is about 142 miles per hour, and the median speed in race B is about 140 miles per hour. The median
speed in race A is about 120 miles per hour, and the median speed in race B is about 125 miles per hour. The
median speed in both races is about 165 miles per hour. The median speed in race A is about 153 miles per
hour, and the median speed in race B is about 145 miles per hour. correct answer D. The median speed in race
A is about 153 miles per hour, and the median speed in race B is about 145 miles per hour. The box plots show
Lauren's chemistry scores and her biology scores. Lauren used the steps below to determine the differences
in the medians and the interquartile ranges. Lauren determined that the difference in the medians is greater
than the difference in the interquartile ranges. Which explains Lauren's error? Lauren made her first error in
step 1 because the median is 85 for chemistry and 80 for biology. Lauren made her first error in step 1 because
the median is 60 for chemistry and 60 for biology. Lauren made her first error in step 3 because she should
have used for chemistry and for biology. Lauren made her first error in step 3 because she should have used
for chemistry and for biology. correct answer D. Lauren made her first error in step 3 because she should
have used for chemistry and for biology. The box plots show the summer temperatures, in degrees
Fahrenheit, in two cities. Linda is trying to decide which city to visit. She likes the summer temperature to be
around . Which city she should visit? She should visit city A because the temperatures are consistently closer
to a median of . She should visit city B because the temperatures are consistently closer to a median of . It
doesn't matter which city she visits because both medians are from . It doesn't matter which city she visits
because it will likely reach in both cities. correct answer B. She should visit city B because the temperatures
are consistently closer to a median of . The box plots show the average gas mileage of cars and minivans
tested by a certain company. Josef says that the range for the car data is greater than the range for the
minivan data because the box in the box plot for the car data is wider. Which explains Josef's error? Josef
confused the range and the interquartile range. Josef confused the range and the median. Josef should have
compared the medians and minimum values. Josef should have compared the medians and maximum values.
correct answer A. Josef confused the range and the interquartile range. The box plots show the average wind
speeds, in miles per hour, for various cities in two different countries. Which statement compares the median
wind speeds for the data in the two box plots? The median wind speed for country A is greater than the
median wind speed for country B. The median wind speed for country B is greater than the median wind
speed for country A. The median wind speed for country A is about 7 miles per hour, and the median wind
speed for country B is about 9 miles per hour. The median wind speed for each country is about 4 miles per
hour. correct answer B. The median wind speed for country B is greater than the median wind speed for
country A. The box plots show the average gas mileage, in miles per gallon, of cars and minivans tested by a
certain company. Which correctly compares the interquartile ranges? The interquartile range for cars is about
12 mpg, and the interquartile range for minivans is about 12 mpg. The interquartile range for cars is about 7
mpg, and the interquartile range for minivans is about 3 mpg. The interquartile range for cars is about 24 mpg,
and the interquartile range for minivans is about 19 mpg. The interquartile range for cars is about 8 mpg, and
the interquartile range for minivans is about 7 mpg. correct answer B. The interquartile range for cars is about
7 mpg, and the interquartile range for minivans is about 3 mpg. The box plots show the weights, in pounds, of
the dogs in two different animal shelters.Weights of Dogs in Shelter A Weights of Dogs in Shelter B Which
animal shelter has the dog that weighs the least? shelter A shelter B Both shelters have a dog with the lowest
weight of 8 pounds. Both shelters have a dog with the lowest weight of 10 pounds. correct answer A. shelter
A The box plots show the number of hours of television a group of middle school students and a group of
elementary school students watch each week.Middle School Students Elementary School Students Which are
true statements when comparing the data in the box plots? Select three choices. The data for elementary
school are more consistent than those for middle school. More of the data for middle school lie closer to the
median than the data for elementary school. About 50% of elementary school students watch between 4 and
7 hours of television each week. About one-half of middle school students watch less than 2 hours of
television each week. On average, middle school students watch less television than elementary school
students each week. correct answer A, C, E - The data for elementary school are more consistent than those
for middle school. - More of the data for middle school lie closer to the median than the data for elementary
school. - On average, middle school students watch less television than elementary school students each
week. The box plots show Rene's scores in Spanish and in French. Which table correctly compares the
measures of center and the measures of variability? correct answerD.