WGU D295
Task 3: Designing Collaborative E-Learning Experiences
A. Plan an e-learning experience as part of a lesson for students in a K–12
population by doing the following:
1. Identify the following components of your e-learning experience:
• topic of the e-learning experience
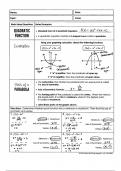
- Graphing and analyzing linear equations.
• description of the e-learning experience
- Students will learn in a collaborative online learning experience where
they will learn how to graph linear equations, identify key
characteristics like the slope and intercepts, and interpret real-world
applications using digital tools.
• grade
- 9th Grade
• learning goal
- Students will be able to accurately graph and analyze linear equations
using multiple representations and apply their understanding to real-
world, problem-solving scenarios.
• learning objectives
- Students will be able to use online tools like Desmos to plot linear
equations in slope-intercept form.
- Students will be able to identify the slope and intercepts in a linear
equation.
- Students will be able to collaborate together on Desmos and Google
Docs to compare different equations and represent them on graphs.
- Students will be able to apply linear equations to real-world scenarios
using real-world data.
• academic standards (Nebraska State Standards)
, - MA 9.2.2.c: Graph linear equations and interpret key features of
the graph.
- MA 9.2.3.a: Interpret the slope and y-intercept in real-world problems.
2. Identify two digital tools you could use for K–12 student
collaboration in an e-learning experience.
- I will use Desmos and Google Docs or Flip
a. Explain how these tools will help students collaborate during
the e-learning experience.
- Desmos: This tool will allow students to graph equations, explore what
changes as they change the equation, and collaborate on graphing
challenges.
- Google Docs or Flip: This tool will allow for group work. They can use a
group owned google doc or a Flip group to share findings, compare their
work, and reflect on what patterns are present across all linear
equations.
3. Explain two collaboration e-learning activities that would help
students achieve the learning goal, learning objectives, or
academic standards from part A1.
Activity 1: Graphing Challenge with Desmos (Learning Goal and Objectives 1-
3)
- Students will work in small groups (2-4) using Desmos to graph
different types of linear equations provided by me. Their challenge will
be to graph each equation and then adjust the parameters to explore
how slight changes can majorly affect the graph. Each group will be
assigned a different set of equations to graph on Desmos, and they will
compare their findings on a group-shared Google Doc.
Activity 2: Real-World Scenarios Discussion (Learning Goal and Objectives 1-
4)
- Students will be given real-world problems, for example, predicting
prices or speed. They will have to create a linear model using
Desmos that will correctly model the problem. To do this they will
need to be able to identify the correct equation, the slope and
intercepts, and a correct graph that matches. Students will then use
tools like Google Docs or Microsoft’s Flip to record and share their
models. They will have to explain how they got to their final answer
and each student will have to give respectful, constructive feedback.
Task 3: Designing Collaborative E-Learning Experiences
A. Plan an e-learning experience as part of a lesson for students in a K–12
population by doing the following:
1. Identify the following components of your e-learning experience:
• topic of the e-learning experience
- Graphing and analyzing linear equations.
• description of the e-learning experience
- Students will learn in a collaborative online learning experience where
they will learn how to graph linear equations, identify key
characteristics like the slope and intercepts, and interpret real-world
applications using digital tools.
• grade
- 9th Grade
• learning goal
- Students will be able to accurately graph and analyze linear equations
using multiple representations and apply their understanding to real-
world, problem-solving scenarios.
• learning objectives
- Students will be able to use online tools like Desmos to plot linear
equations in slope-intercept form.
- Students will be able to identify the slope and intercepts in a linear
equation.
- Students will be able to collaborate together on Desmos and Google
Docs to compare different equations and represent them on graphs.
- Students will be able to apply linear equations to real-world scenarios
using real-world data.
• academic standards (Nebraska State Standards)
, - MA 9.2.2.c: Graph linear equations and interpret key features of
the graph.
- MA 9.2.3.a: Interpret the slope and y-intercept in real-world problems.
2. Identify two digital tools you could use for K–12 student
collaboration in an e-learning experience.
- I will use Desmos and Google Docs or Flip
a. Explain how these tools will help students collaborate during
the e-learning experience.
- Desmos: This tool will allow students to graph equations, explore what
changes as they change the equation, and collaborate on graphing
challenges.
- Google Docs or Flip: This tool will allow for group work. They can use a
group owned google doc or a Flip group to share findings, compare their
work, and reflect on what patterns are present across all linear
equations.
3. Explain two collaboration e-learning activities that would help
students achieve the learning goal, learning objectives, or
academic standards from part A1.
Activity 1: Graphing Challenge with Desmos (Learning Goal and Objectives 1-
3)
- Students will work in small groups (2-4) using Desmos to graph
different types of linear equations provided by me. Their challenge will
be to graph each equation and then adjust the parameters to explore
how slight changes can majorly affect the graph. Each group will be
assigned a different set of equations to graph on Desmos, and they will
compare their findings on a group-shared Google Doc.
Activity 2: Real-World Scenarios Discussion (Learning Goal and Objectives 1-
4)
- Students will be given real-world problems, for example, predicting
prices or speed. They will have to create a linear model using
Desmos that will correctly model the problem. To do this they will
need to be able to identify the correct equation, the slope and
intercepts, and a correct graph that matches. Students will then use
tools like Google Docs or Microsoft’s Flip to record and share their
models. They will have to explain how they got to their final answer
and each student will have to give respectful, constructive feedback.