D772 Statistical Data Literacy COMBINED SECTIONS STUDY
GUIDE (Fundamental Concepts and Key Definitions in Statistics)
Section 1,2,3 2025 UPDATE Western Governors University
,Fundamental Concepts and Key Definitions in Statistics
Data
Data refers to the actual values of the variables collected for analysis.
It serves as the raw information that provides insights into the studied phenomenon.
Variables
Variables are characteristics or measurements of interest in a study.
They can be classified into quantitative (numerical) and categorical (qualitative) types.
Population, Sample, and Individual
The population is the entire group of individuals or objects being studied (e.g., all high school students in the U.S.).
A sample is a smaller, manageable group selected from the population to represent it (e.g., 500 high school students from various
states).
Individuals are the objects described by a set of data, which can include people, animals, or things. They
are the entities on which data is collected.
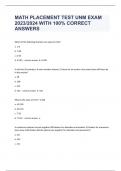
Table 1.1. Populations vs. Samples: Key Differences and Examples
Term Definition Example
Population The entire group of individuals or objects that youAll high school students in the United
want to study.States.
Sample A smaller, more manageable group selected from A group of 500 high school students from
the population to represent the larger group. different states across the U.S.
Statistics
A statistic is a numerical value that describes a characteristic of a sample.
It is calculated from sample data and used to estimate population parameters.
Parameters
A parameter is a numerical value that describes characteristics of an entire population.
Parameters are often unknown due to the impracticality of measuring every individual in a large population.
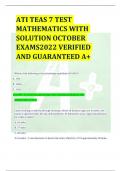
Table 1.2. Parameters vs. Statistics Examples
Term Definition Example
Parameter A numerical value that describes a The average height of all adult women in the
characteristic of a population. United States.
Statistic A numerical value that describes a The average height of 100 adult women randomly
characteristic of a sample. selected from the United States.
Numerical Values
Numerical values represent characteristics of populations (parameters) and samples (statistics).
Understanding the distinction between parameters and statistics is crucial for interpreting results.
,Types of Variables
Quantitative Variables
Quantitative variables are numerical measurements (e.g., age, height, weight, income). They
allow for mathematical operations and statistical analysis.
Categorical Variables
Categorical variables consist of categories or labels (e.g., gender, race, occupation). They are
used to classify individuals into distinct groups.
Example:
Scenario:
We want to know the average (mean) amount of money first-year university students spend at Strime University on school supplies that do
not include books. We randomly surveyed 100 first-year students at the college. Three of those students spent $150, $200, and $225,
respectively.
Population:
The population refers to the entire group being studied, which in this case is all first-year students at Strime University.
Sample:
The sample is the subset of the population that was actually surveyed, which in this case is 100 randomly selected first-year students.
Statistic:
A statistic is a value calculated from the sample data, such as the sample mean.
Variable:
A variable is the characteristic being measured, which in this case is the amount of money spent by each student.
Data:
Data are the actual measurements or observations, which in this case are the dollar amounts spent by students.
Parameter:
A parameter is a characteristic of the entire population, such as the true average spending of all first-year students.
Sampling Methods
Stratified Sampling
Dividing the population into distinct subgroups called strata, based on specific characteristics such as age, gender, or socioeconomic
status. Once the population is divided into strata, a random sample is taken from each stratum in proportion to its representation in
the overall population. This ensures that the sample reflects the diversity of the population in terms of the chosen characteristics.
Strata: Subgroups within a population that share a common characteristic (e.g., age group, gender, income level).
Proportionate Sample: A sample where the number of individuals selected from each stratum is proportional to the size of
that stratum in the population.
Cluster Sampling
Dividing the population into clusters, which are naturally occurring groups like schools, neighborhoods, or cities. Instead of randomly
selecting individuals from the entire population, researchers randomly select a few clusters and include all
, individuals within those selected clusters in the sample. This method is often used when it's difficult or expensive to sample
individuals directly from the entire population.
Cluster: A naturally occurring group within a population (e.g., school, neighborhood, city).
Systematic Sampling
Selecting every "nth" individual from a list of the population, starting from a randomly chosen point. This method is often used when
it's easy to access a list of the entire population.
Sampling Interval: The fixed distance between the selected elements in a systematic sample.
Types of Studies
Observational Studies:
In an observational study, researchers observe and record data on variables as they naturally occur, without any intervention or
manipulation.
Example: A researcher observes and records the eating habits and weight of a group of individuals over a year to see if there is a
relationship between diet and weight gain.
Sample Surveys:
A sample survey is a specific type of observational study where individuals self-report the values of variables, often by providing
their opinions or answering questions. Surveys are commonly used to gather information about attitudes, beliefs, behaviors, and
demographics.
Example: Researchers select a random sample of 1,750 U.S. eligible voters and collect data on their opinions regarding their political
preferences.
Experiments:
In an experiment, researchers intentionally manipulate one or more variables (the explanatory variables) to observe their effect on
another variable (the response variable). Participants are randomly assigned to different groups, with each group receiving a
different treatment or level of the explanatory variable.
Example: A researcher randomly assigns participants to two groups: one group receives a new drug for high blood pressure, while
the other group receives an inactive treatment, also known as a placebo. The researcher then compares the blood pressure readings
of the two groups to determine if the drug is effective.
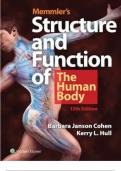
Table 1.9. Comparison of Different Study Types
Study Type Researcher's Role
Observational Study Observe and record data without intervention.
Sample Survey Ask individuals to self-report the values of variables.
Experiment Manipulate variables and observe their effects.
Key Principles of Experimental Design:
Designing Experiments
The purpose of an experiment is to investigate the relationship between two variables in a controlled environment, with the
goal of preventing other factors (known or unknown) from influencing the variables. In a randomized experiment, researchers manipulate
the explanatory variable and measure the resulting changes in the response variable.
Explanatory variable: the variable believed to cause the change.
Response variable: the variable that is affected.
Treatments: The different values of the explanatory variable.
GUIDE (Fundamental Concepts and Key Definitions in Statistics)
Section 1,2,3 2025 UPDATE Western Governors University
,Fundamental Concepts and Key Definitions in Statistics
Data
Data refers to the actual values of the variables collected for analysis.
It serves as the raw information that provides insights into the studied phenomenon.
Variables
Variables are characteristics or measurements of interest in a study.
They can be classified into quantitative (numerical) and categorical (qualitative) types.
Population, Sample, and Individual
The population is the entire group of individuals or objects being studied (e.g., all high school students in the U.S.).
A sample is a smaller, manageable group selected from the population to represent it (e.g., 500 high school students from various
states).
Individuals are the objects described by a set of data, which can include people, animals, or things. They
are the entities on which data is collected.
Table 1.1. Populations vs. Samples: Key Differences and Examples
Term Definition Example
Population The entire group of individuals or objects that youAll high school students in the United
want to study.States.
Sample A smaller, more manageable group selected from A group of 500 high school students from
the population to represent the larger group. different states across the U.S.
Statistics
A statistic is a numerical value that describes a characteristic of a sample.
It is calculated from sample data and used to estimate population parameters.
Parameters
A parameter is a numerical value that describes characteristics of an entire population.
Parameters are often unknown due to the impracticality of measuring every individual in a large population.
Table 1.2. Parameters vs. Statistics Examples
Term Definition Example
Parameter A numerical value that describes a The average height of all adult women in the
characteristic of a population. United States.
Statistic A numerical value that describes a The average height of 100 adult women randomly
characteristic of a sample. selected from the United States.
Numerical Values
Numerical values represent characteristics of populations (parameters) and samples (statistics).
Understanding the distinction between parameters and statistics is crucial for interpreting results.
,Types of Variables
Quantitative Variables
Quantitative variables are numerical measurements (e.g., age, height, weight, income). They
allow for mathematical operations and statistical analysis.
Categorical Variables
Categorical variables consist of categories or labels (e.g., gender, race, occupation). They are
used to classify individuals into distinct groups.
Example:
Scenario:
We want to know the average (mean) amount of money first-year university students spend at Strime University on school supplies that do
not include books. We randomly surveyed 100 first-year students at the college. Three of those students spent $150, $200, and $225,
respectively.
Population:
The population refers to the entire group being studied, which in this case is all first-year students at Strime University.
Sample:
The sample is the subset of the population that was actually surveyed, which in this case is 100 randomly selected first-year students.
Statistic:
A statistic is a value calculated from the sample data, such as the sample mean.
Variable:
A variable is the characteristic being measured, which in this case is the amount of money spent by each student.
Data:
Data are the actual measurements or observations, which in this case are the dollar amounts spent by students.
Parameter:
A parameter is a characteristic of the entire population, such as the true average spending of all first-year students.
Sampling Methods
Stratified Sampling
Dividing the population into distinct subgroups called strata, based on specific characteristics such as age, gender, or socioeconomic
status. Once the population is divided into strata, a random sample is taken from each stratum in proportion to its representation in
the overall population. This ensures that the sample reflects the diversity of the population in terms of the chosen characteristics.
Strata: Subgroups within a population that share a common characteristic (e.g., age group, gender, income level).
Proportionate Sample: A sample where the number of individuals selected from each stratum is proportional to the size of
that stratum in the population.
Cluster Sampling
Dividing the population into clusters, which are naturally occurring groups like schools, neighborhoods, or cities. Instead of randomly
selecting individuals from the entire population, researchers randomly select a few clusters and include all
, individuals within those selected clusters in the sample. This method is often used when it's difficult or expensive to sample
individuals directly from the entire population.
Cluster: A naturally occurring group within a population (e.g., school, neighborhood, city).
Systematic Sampling
Selecting every "nth" individual from a list of the population, starting from a randomly chosen point. This method is often used when
it's easy to access a list of the entire population.
Sampling Interval: The fixed distance between the selected elements in a systematic sample.
Types of Studies
Observational Studies:
In an observational study, researchers observe and record data on variables as they naturally occur, without any intervention or
manipulation.
Example: A researcher observes and records the eating habits and weight of a group of individuals over a year to see if there is a
relationship between diet and weight gain.
Sample Surveys:
A sample survey is a specific type of observational study where individuals self-report the values of variables, often by providing
their opinions or answering questions. Surveys are commonly used to gather information about attitudes, beliefs, behaviors, and
demographics.
Example: Researchers select a random sample of 1,750 U.S. eligible voters and collect data on their opinions regarding their political
preferences.
Experiments:
In an experiment, researchers intentionally manipulate one or more variables (the explanatory variables) to observe their effect on
another variable (the response variable). Participants are randomly assigned to different groups, with each group receiving a
different treatment or level of the explanatory variable.
Example: A researcher randomly assigns participants to two groups: one group receives a new drug for high blood pressure, while
the other group receives an inactive treatment, also known as a placebo. The researcher then compares the blood pressure readings
of the two groups to determine if the drug is effective.
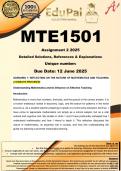
Table 1.9. Comparison of Different Study Types
Study Type Researcher's Role
Observational Study Observe and record data without intervention.
Sample Survey Ask individuals to self-report the values of variables.
Experiment Manipulate variables and observe their effects.
Key Principles of Experimental Design:
Designing Experiments
The purpose of an experiment is to investigate the relationship between two variables in a controlled environment, with the
goal of preventing other factors (known or unknown) from influencing the variables. In a randomized experiment, researchers manipulate
the explanatory variable and measure the resulting changes in the response variable.
Explanatory variable: the variable believed to cause the change.
Response variable: the variable that is affected.
Treatments: The different values of the explanatory variable.