Applied Data Visualisation for Economists I
ECB2ADAVE1
Utrecht University
2023-24
,Week 1: Introduction
Data Analysis
- Creating results which help the analyst understand data and make predictions
Example:
- Oversimplification
- Data analysis estimates a model ‘f’ to summarize our data, composed of outcome Y
and a set of predictors
- Data science mostly interested in prediction (Y-hat)
- Vs empirical research, mostly interested in inference (relationship between X and Y)
- Linear regression:
- Data science interested in y-hat, while empirical research interested in beta
(magnitude, significance etc)
Goals of data science and example questions
- Description: what happened
- Election winner
- Trending twitter topics
- Website traffic over given time
- Explanation/diagnostic: why did/does something happen
- Underrepresentation of women in STEM degrees
- Prediction: what is likely to happen in future
- Climate change (also description)
- Prescription: what shall we do
- Best way to prevent heart failure
,Modes of data analysis
- Exploratory
- Follow your gut (or other criteria to yield interesting results)
- Open-minded investigation to uncover patterns and understand data
- Generate new insights
- Create new hypotheses
- Confirmatory
- Tests specific hypotheses and confirms relationships with targeted analytical
techniques
- Validate/refute hypotheses
- Analysis predefined.
Examples
- Exploratory:
- EDA – describe patterns using graphs, summaries to understand subgroups,
outliers, understand data.
Boxplot, barplot, histograms, scatterplots
- Unsupervised learning
-
Inputs, but no outputs. Tries to learn structure from these data, like
detecting unobserved groups from data
E.g. a retail store has customer data (age, income, no of purchases, av.
Purchase amount)
UL (e.g. clustering data) can gain insights into customer segmentation,
behaviour patterns and preferences
- Types of clustering: K-means clustering and hierarchical clustering
- correlation analysis
- Confirmatory:
- hypothesis testing
e.g. is new drug treatment effective in reducing blood pressure vs placebo
drug
test hypothesis. Analysis can be defined in advance – outcome variables,
how to sample/which method from population.
Supervised learning
build a statistical model for predicting/estimating an output based on one
or more inputs (input-model-output)
, most widely used machine learning methods are supervised (e.g. spam
classifiers on email, facial recognition, medical diagnosis systems for
patients)
classification vs. regression
Classification: assign
observation to category
(qualitative)
Regression: predict a
quantitative outcome
- Causal modelling
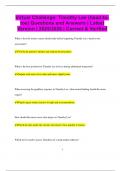
Model accuracy vs interpretability:
- left model is less flexible (produces small range of shapes to estimate f
- right model more flexible and allow curve relationships
Poses question as to why use a more restrictive model over a flexible approach?
- Restrictive to prioritise interpretability
- Simpler, less prone to overfitting, easier to explain
- Preferable in scenarios where model transparency and comprehensibility are more
important
Restrictive vs flexible:
ECB2ADAVE1
Utrecht University
2023-24
,Week 1: Introduction
Data Analysis
- Creating results which help the analyst understand data and make predictions
Example:
- Oversimplification
- Data analysis estimates a model ‘f’ to summarize our data, composed of outcome Y
and a set of predictors
- Data science mostly interested in prediction (Y-hat)
- Vs empirical research, mostly interested in inference (relationship between X and Y)
- Linear regression:
- Data science interested in y-hat, while empirical research interested in beta
(magnitude, significance etc)
Goals of data science and example questions
- Description: what happened
- Election winner
- Trending twitter topics
- Website traffic over given time
- Explanation/diagnostic: why did/does something happen
- Underrepresentation of women in STEM degrees
- Prediction: what is likely to happen in future
- Climate change (also description)
- Prescription: what shall we do
- Best way to prevent heart failure
,Modes of data analysis
- Exploratory
- Follow your gut (or other criteria to yield interesting results)
- Open-minded investigation to uncover patterns and understand data
- Generate new insights
- Create new hypotheses
- Confirmatory
- Tests specific hypotheses and confirms relationships with targeted analytical
techniques
- Validate/refute hypotheses
- Analysis predefined.
Examples
- Exploratory:
- EDA – describe patterns using graphs, summaries to understand subgroups,
outliers, understand data.
Boxplot, barplot, histograms, scatterplots
- Unsupervised learning
-
Inputs, but no outputs. Tries to learn structure from these data, like
detecting unobserved groups from data
E.g. a retail store has customer data (age, income, no of purchases, av.
Purchase amount)
UL (e.g. clustering data) can gain insights into customer segmentation,
behaviour patterns and preferences
- Types of clustering: K-means clustering and hierarchical clustering
- correlation analysis
- Confirmatory:
- hypothesis testing
e.g. is new drug treatment effective in reducing blood pressure vs placebo
drug
test hypothesis. Analysis can be defined in advance – outcome variables,
how to sample/which method from population.
Supervised learning
build a statistical model for predicting/estimating an output based on one
or more inputs (input-model-output)
, most widely used machine learning methods are supervised (e.g. spam
classifiers on email, facial recognition, medical diagnosis systems for
patients)
classification vs. regression
Classification: assign
observation to category
(qualitative)
Regression: predict a
quantitative outcome
- Causal modelling
Model accuracy vs interpretability:
- left model is less flexible (produces small range of shapes to estimate f
- right model more flexible and allow curve relationships
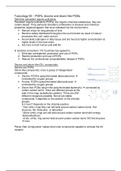
Poses question as to why use a more restrictive model over a flexible approach?
- Restrictive to prioritise interpretability
- Simpler, less prone to overfitting, easier to explain
- Preferable in scenarios where model transparency and comprehensibility are more
important
Restrictive vs flexible: