MAT 240 FINAL REVIEW QUESTIONS WITH 100%
ACCURATE SOLUTIONS
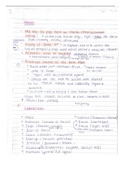
what're the four steps to statistical problem solving?
1. formulate questions
2. collect data
3. organize and display
4. analyze and interpret data
when collecting data, the entire group is called what?
the population
what is a subset of the population called?
a sample
dot or line plot
each value is displayed and repeated values can be easily seen
stem and leaf plot
a graph used to organize and display data so that the frequencies can be compared
histogram
a graph of vertical bars representing the frequency distribution of a set of data
bar graph
data can be displayed horizontally or vertically, similar to a histogram yet the bars don't touch
line graph
, a graph that uses line segments to show changes that occur over time
circle (or pie chart)
useful for comparing parts of a whole
pictograph
uses icons to symbolize amounts being represented, a key is necessary to know how much each
icon represents
scatter plot
used when data is grouped into pairs of numbers that can be plotted in an (x,y) plane
what is anohter term for an average?
measures of central tendency
whatre the three measures of central tendency?
mean, median, mode
what is the mode?
most frequently occurring number
what is the median?
the middle number
what is the mean?
the average of all numbers
statistics that tell us about how the data is distributed are called?
measures of dispersion
what is the range?
the difference between the highest and lowest scores in a distribution
ACCURATE SOLUTIONS
what're the four steps to statistical problem solving?
1. formulate questions
2. collect data
3. organize and display
4. analyze and interpret data
when collecting data, the entire group is called what?
the population
what is a subset of the population called?
a sample
dot or line plot
each value is displayed and repeated values can be easily seen
stem and leaf plot
a graph used to organize and display data so that the frequencies can be compared
histogram
a graph of vertical bars representing the frequency distribution of a set of data
bar graph
data can be displayed horizontally or vertically, similar to a histogram yet the bars don't touch
line graph
, a graph that uses line segments to show changes that occur over time
circle (or pie chart)
useful for comparing parts of a whole
pictograph
uses icons to symbolize amounts being represented, a key is necessary to know how much each
icon represents
scatter plot
used when data is grouped into pairs of numbers that can be plotted in an (x,y) plane
what is anohter term for an average?
measures of central tendency
whatre the three measures of central tendency?
mean, median, mode
what is the mode?
most frequently occurring number
what is the median?
the middle number
what is the mean?
the average of all numbers
statistics that tell us about how the data is distributed are called?
measures of dispersion
what is the range?
the difference between the highest and lowest scores in a distribution