, 1.
1.
a.
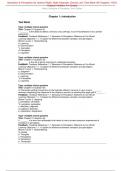
b. The stacked bar plot shows the proportion of females across different ranks. The
distribution shows that a larger proportion of women are at the lower ranks
(assistant and associate) rather than at the full-time professor level. This pattern is
consistent with common gender bias in society, where women are often
underrepresented in high rank positions due to structural barriers, hiring practices,
and promotion disparities.
2.
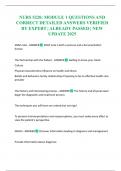
a. bin = 10,000
1.
a.
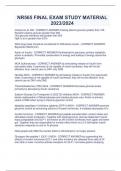
b. The stacked bar plot shows the proportion of females across different ranks. The
distribution shows that a larger proportion of women are at the lower ranks
(assistant and associate) rather than at the full-time professor level. This pattern is
consistent with common gender bias in society, where women are often
underrepresented in high rank positions due to structural barriers, hiring practices,
and promotion disparities.
2.
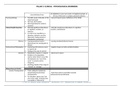
a. bin = 10,000