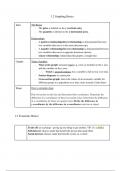
1.2 Graphing Basics
Intro The Basics
- The price is labeled on the y (vertical axis).
- The quantity is labeled on the x (horizontal axis).
Relationships
- A positive relationship/direct relationship is demonstrated between
two variables that move in the same direction (up).
- A negative relationship/inverse relationship is demonstrated between
two variables that move in opposite directions (down).
- Linear relationship: relationship that graphs a straight line
Graphs Types of graphs:
- Time-series graph: measures time (e.g. years or months) on the x axis
and the variable on the y axis.
- Trend: a general tendency for a variable to fall or rise over time.
- Scatter diagram: or scatter plot
- Cross-section graph: shows the values of an economic variable for
different groups in a population over time. (bars instead of dots/lines)
Slope How to calculate slope
Pick two points on the line and determine their coordinates. Determine the
difference in y-coordinates of these two points (rise). Determine the difference
in x-coordinates for these two points (run). Divide the difference in
y-coordinates by the difference in x-coordinates (rise/run or slope).
1.3 Economic Basics
Trade off: an exchange - giving up one thing to get another. TIP: it’s a choice
Self-interest: choices made that benefit the person that made them
Social-interest: choices made that benefit society as a whole
,Opportunity cost: the amount of one good that must be sacrificed to obtain an
alternative good.
● What you give up.
Opportunity cost of good A = change in good B production/change in good A
production =
Opportunity cost of good B = change in good A production/change in good B
production.
● Change in good (A/B) production is the number of that good lost or
gained.
OR
OC of good A = amount of time required to make 1 unit of good A/amount of
time required to make 1 unit of good B
= (whatever number) of GOOD B
● Vice versa.
EG. Opportunity cost of wheat = 5/10 = ½ cloth
Opportunity cost of cloth = 10/5 = 2 wheat
★OC of good A = whatever amount + of good B
Benefit: the benefit of something is the gain or pleasure it brings. It’s measured by
what you are willing to give up to get it.
Margin
● Margin: a choice at the margin is a choice that is made by comparing all
the relevant alternatives systematically and incrementally.
● Marginal cost: what you must give up to get one additional unit of it.
● Marginal benefit: the benefit that arises from a one-unit increase in that
activity. Measured by what you are willing to give up to get one additional
unit of it.
Incentives: anything that motivates someone to perform an action.
Economic model: A description of the economy or a part of the economy that
includes only those features assumed necessary to explain the observed facts.
, Consumption goods/services: goods/services that individuals and the
government buy and use in the current period.
- E.g. Milk, cereal, computers, books, dental services. By the government -
education, fire/police services, etc.
Capital goods/services: goods/services that businesses and the government buy
to increase productive resources (factors of production) and use over future
periods to produce other goods/services.
- E.g. Shopping malls, airplanes, oil tankers, warehouses.
Property rights: valuable items (land, capital, intellectual property (a patent on
an invention), etc) in the economy have specific owners.
Law of Diminishing Marginal Returns: if you increase a variable factor of
production during production along with fixed production factors, eventually the
amount produced will diminish.
E.g. If you increase the number of workers while maintaining the same
capital, eventually productivity will decrease and the product/service would
diminish.
Factors of income
● Wages: income paid for the services of labor.
● Rent: income paid for the use of land.
● Profit: income earned by an entrepreneur for running a business.
● Interest: income paid for the use of capital.
Factors of production
● Land: ALL natural resources. EG. rivers, grass, trees, oil, coal, energy, air.
● Labor: all human activity that is productive. EG. workers and laborers.
● Capital: productive equipment or machinery.
● Entrepreneurship: the human resource that organizes labor, land, and capital to produce goods/services.
1.4 Production Possibilities Curve
The economic problem: our wants exceed what is possible for our resources to
do.
Production possibility frontier (PPF): the combinations of two goods that
can be produced if the economy uses all of its resources fully and efficiently.
● The PPF shows the limits to production and what is possible.
, Two factors can cause the production possibilities frontier to shift:
★ Changes in technology and productivity.
★ Changes in the amount of resources in an economy. Unemployment does
not shift.
Law of increasing costs: as more of a good is produced, the opportunity cost
increases.
● Results in a conclave-to-the-origin PPF. (not a straight line) Curved.
● Increases because more resources are forced into industries where they
aren’t as productive.
Only the points on the PPF and inside it (in the orange area) are attainable.
The combinations of smartphones and bikes beyond the PPF (in the white
area), such as the combination at point G, are unattainable.
Production efficiency: a situation in which the economy is getting all that it
can from its resources and cannot produce more of one good or service without
producing less of something else.
Trade off: choice. Free lunch: a gift - getting something without having to
give up anything.
● When production is efficient—at a point on the PPF—choosing to
produce more of one good involves a tradeoff. But if production is
inefficient—at a point inside the PPF—there is a free lunch.
Calculating opportunity cost:
The opportunity cost of producing a smartphone is the number of bikes
forgone to get an additional smartphone.
● It is calculated as the number of bikes forgone divided by the number