Data analysis 1 lecture 1
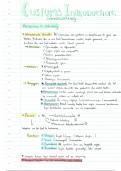
SE (standard error) is related to smaller sample sizes
SD (standard deviation) is related to larger sample sizes
Df = degrees of freedom = n-1
Sampling distribution of the mean is normal if:
- Population distribution is a normal distribution (lets say a country)
- AND/OR the sample size is large enough > 50 (Central Limit Theorem)
5 examples:
,The larger the sample you have, the more certainty you have about the mean.
Sampling distributions: behave predictably for most population distributions
- Mean of the sampling distribution is the population mean
- Shape of sampling distribution is approximately normal for large sample sizes
- The spread of the sampling distribution depends on the spread of the population
distribution and the sample size
Standard error (SE):
Show:
◼ That standard deviation of the sampling distribution (=sampling error) represents
uncertainty
◼ Is computed in the following way
◼ The larger the samples, the closer the sample means are to the population mean →
sample size is important!
The t-distribution
When s is used to estimate the SE, the distribution is no longer a normal distribution.
There are different t-distributions for different sample sizes.
,The shape of the t-distribution depends on the degrees of freedom (n-1)
The t-statistic
t-values are like z-values
In a t-distribution you can find t-values
, Confidence intervals:
To show how this works: