TEST BANK
,1. What is the total number of scores for the distribution shown in the following table?
X f
4 3
3 5
2 4
1 2
a. 4
b. 10
c. 14
d. 37
ANSWER: c
REFERENCES: 2.1 Frequency Distributions and Frequency Distribution Tables
QUESTION TYPE: Multiple Choice
KEYWORDS: Bloom’s: Understand
2. A sample of n = 15 scores ranges from a high of X = 11 to a low of X = 3. If these scores are placed in a frequency
distribution table, how many X values will be listed in the first column of that table?
a. 8
b. 9
c. 11
d. 15
ANSWER: b
REFERENCES: 2. 1 Frequency Distributions and Frequency Distribution Tables
QUESTION TYPE: Multiple Choice
KEYWORDS: Bloom’s: Understand
3. For the following frequency distribution of quiz scores, how many individuals took the quiz?
X f
5 6
4 5
3 5
2 3
1 2
a. n = 5
b. n = 7
c. n = 15
d. n = 21
ANSWER: d
REFERENCES: 2. 1 Frequency Distributions and Frequency Distribution Tables
QUESTION TYPE: Multiple Choice
KEYWORDS: Bloom’s: Understand
4. For the following distribution of quiz scores, if a score of X = 3 or higher is needed for a passing grade, how many
individuals passed?
X f
5 6
4 5
3 5
,2 3
1 2
a. 3
b. 11
c. 16
d. 21
ANSWER: c
REFERENCES: 2. 1 Frequency Distributions and Frequency Distribution Tables
QUESTION TYPE: Multiple Choice
KEYWORDS: Bloom’s: Understand
5. For the following distribution of quiz scores, How many individuals had a score of X = 2?
X f
5 6
4 5
3 5
2 3
1 2
a. 1
b. 2
c. 3
d. 5
ANSWER: c
REFERENCES: 2. 1 Frequency Distributions and Frequency Distribution Tables
QUESTION TYPE: Multiple Choice
KEYWORDS: Bloom’s: Understand
6. For the following frequency distribution of exam scores, what is the lowest possible reported score on the exam?
X f
90-94 3
85-89 4
80-84 5
75-79 2
70-74 1
a. x = 70
b. x = 74
c. x = 90
d. x=94
ANSWER: a
REFERENCES: 2.2 Grouped Frequency Distribution Tables
QUESTION TYPE: Multiple Choice
KEYWORDS: Bloom’s: Understand
7. For the following frequency distribution of exam scores, how many students had scores lower than X = 80?
X f
90-94 3
85-89 4
80-84 5
75-79 2
,70-74 1
a. 2
b. 3
c. 7
d. 8
ANSWER: b
REFERENCES: 2.2 Grouped Frequency Distribution Tables
QUESTION TYPE: Multiple Choice
KEYWORDS: Bloom’s: Understand
8. In a grouped frequency distribution one interval is listed as 50-59. Assuming that the scores are measuring a
continuous variable, what are the real limits of this interval?
a. 50 and 59
b. 50.5 and 59.5
c. 49.5 and 59.5
d. 49.5 and 60.5
ANSWER: c
REFERENCES: 2.2 Grouped Frequency Distribution Tables
QUESTION TYPE: Multiple Choice
KEYWORDS: Bloom’s: Understand
9. For the following distribution, how many people had scores less than X = 20?
X f
20-25 2
15-19 5
10-14 4
5-9 1
a. 5
b. 10
c. 11
d. 12
ANSWER: b
REFERENCES: 2.2 Grouped Frequency Distribution Tables
QUESTION TYPE: Multiple Choice
KEYWORDS: Bloom’s: Understand
10. For the following distribution, what is the highest possible score?
X f
20-25 2
15-19 5
10-14 4
5-9 1
a. 5
b. 20
c. 25
d. 26
ANSWER: c
REFERENCES: 2.2 Grouped Frequency Distribution Tables
,QUESTION TYPE: Multiple Choice
KEYWORDS: Bloom’s: Understand
11. For the following distribution, how many people had scores greater than X = 14?
X f
20-25 2
15-19 5
10-14 4
5-9 1
a. 5
b. 7
c. 10
d. 11
ANSWER: b
REFERENCES: 2.2 Grouped Frequency Distribution Tables
QUESTION TYPE: Multiple Choice
KEYWORDS: Bloom’s: Understand
12. For the following distribution, what is the width of each class interval?
X f
20-24 2
5-19 5
10-14 4
5-9 1
a. 4
b. 4.5
c. 5
d. 10
ANSWER: c
REFERENCES: 2.2 Grouped Frequency Distribution Tables
QUESTION TYPE: Multiple Choice
KEYWORDS: Bloom’s: Understand
13. If the following continuous distribution was shown in a histogram, the bar above the 15-19 interval would reach from
to .
X f
20-25 2
15-19 5
10-14 4
5-9 1
a. X = 14.5 to X = 19.5
b. X = 15.0 to X = 19.0
c. X = 15.5 to X = 18.5
d. X = 15.5 to X = 19.5
ANSWER: a
REFERENCES: 2.3 Frequency Distribution Graphs
QUESTION TYPE: Multiple Choice
KEYWORDS: Bloom’s: Understand
,14. In qa qfrequency qdistribution qgraph, qfrequencies qare qpresented qon qthe q and qthe qscores q(categories) qare
qlisted qon qthe
.
a. X qaxis; qY qaxis
b. horizontal qline; qvertical qline
c. Y qaxis; qX qaxis
d. class qinterval q;horizontal qline
ANSWER: c
REFERENCES: 2.3 qFrequency qDistribution
qGraphs
QUESTION qTYPE: Multiple qChoice
KEYWORDS: Bloom’s: qRemember
15. What qfrequency qdistribution qgraph qis qappropriate qfor qscores qmeasured qon qa qnominal qscale?
a. only qa qhistogram
b. only qa qpolygon
c. either qa qhistogram qor qa qpolygon
d. only qa qbar qgraph
ANSWER: d
REFERENCES: 2.3 qFrequency qDistribution
qGraphs
QUESTION Multiple qChoice
qTYPE:
KEYWORDS: Bloom’s: qUnderstand
16. The qclassrooms qin qthe qPsychology qdepartment qare qnumbered qfrom q100 qto q108. q A qprofessor
qrecords qthe qnumber qof qclasses qheld qin qeach qroom qduring qthe qfall qsemester. q If qthese qvalues qare
qpresented qin qa qfrequency qdistribution qgraph, qwhat qkind qof q graph qwould qbe qappropriate?
a. a qhistogram
b. a q polygon
c. a qhistogram qor qa qpolygon
d. a qbar
qgraph
ANSWER: d
REFERENCES: 2.3 qFrequency qDistribution
qGraphs
QUESTION Multiple qChoice
qTYPE:
KEYWORDS: Bloom’s: qApply
17. A qresearcher qrecords qthe qnumber qof qtraffic qtickets qissued qin qeach qcounty qalong qthe qNew qYork
qState qthruway. qIf qthe qresults qare qpresented qin q a qfrequency qdistribution q graph, qwhat qkind qof qgraph
qshould qbe qused?
a. a qbar
qgraph
b. a qhistogram
c. a qpolygon
d. either qa qhistogram qor qa qpolygon
ANSWER: a
, REFERENCES: 2.3 qFrequency qDistribution
qGraphs
QUESTION Multiple qChoice
qTYPE:
KEYWORDS: Bloom’s: qApply
18. What qkind qof qfrequency qdistribution qgraph qshows qthe qfrequencies qas qbars, qwith qno qspace qbetween
qadjacent qbars?
a. a qbar
qgraph
b. a
qhistogram
c. a qpolygon
d. a qpie qchart
ANSWER: b
REFERENCES: 2.3 qFrequency qDistribution
qGraphs
QUESTION Multiple qChoice
qTYPE:
KEYWORDS: Bloom’s: qRemember
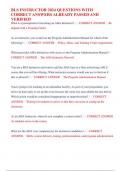
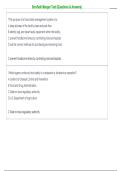
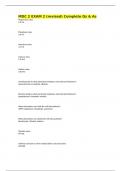
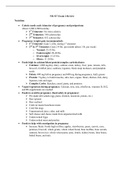
Figure q2.1
19. What qscale qof qmeasurement qwas qused qto qmeasure qthe qscores qin qthe qdistribution qshown qin qthe
qaccompanying qgraph, qFigure q2.1?
a. nominal
b. ordinal
c. interval qor qratio
d. non-numeric
ANSWER: c
REFERENCES: 2.3 qFrequency qDistribution
qGraphs
QUESTION Multiple qChoice
qTYPE:
PREFACE qNAME: Figure q2.1
KEYWORDS: Bloom’s: qUnderstand
20. For qthe qdistribution qin qthe qaccompanying qgraph, qFigure q2.1, qwhat qis qthe qvalue qof qΣX?
a. 10
b. 15
c. 21
d. 30
,1. What is the total number of scores for the distribution shown in the following table?
X f
4 3
3 5
2 4
1 2
a. 4
b. 10
c. 14
d. 37
ANSWER: c
REFERENCES: 2.1 Frequency Distributions and Frequency Distribution Tables
QUESTION TYPE: Multiple Choice
KEYWORDS: Bloom’s: Understand
2. A sample of n = 15 scores ranges from a high of X = 11 to a low of X = 3. If these scores are placed in a frequency
distribution table, how many X values will be listed in the first column of that table?
a. 8
b. 9
c. 11
d. 15
ANSWER: b
REFERENCES: 2. 1 Frequency Distributions and Frequency Distribution Tables
QUESTION TYPE: Multiple Choice
KEYWORDS: Bloom’s: Understand
3. For the following frequency distribution of quiz scores, how many individuals took the quiz?
X f
5 6
4 5
3 5
2 3
1 2
a. n = 5
b. n = 7
c. n = 15
d. n = 21
ANSWER: d
REFERENCES: 2. 1 Frequency Distributions and Frequency Distribution Tables
QUESTION TYPE: Multiple Choice
KEYWORDS: Bloom’s: Understand
4. For the following distribution of quiz scores, if a score of X = 3 or higher is needed for a passing grade, how many
individuals passed?
X f
5 6
4 5
3 5
,2 3
1 2
a. 3
b. 11
c. 16
d. 21
ANSWER: c
REFERENCES: 2. 1 Frequency Distributions and Frequency Distribution Tables
QUESTION TYPE: Multiple Choice
KEYWORDS: Bloom’s: Understand
5. For the following distribution of quiz scores, How many individuals had a score of X = 2?
X f
5 6
4 5
3 5
2 3
1 2
a. 1
b. 2
c. 3
d. 5
ANSWER: c
REFERENCES: 2. 1 Frequency Distributions and Frequency Distribution Tables
QUESTION TYPE: Multiple Choice
KEYWORDS: Bloom’s: Understand
6. For the following frequency distribution of exam scores, what is the lowest possible reported score on the exam?
X f
90-94 3
85-89 4
80-84 5
75-79 2
70-74 1
a. x = 70
b. x = 74
c. x = 90
d. x=94
ANSWER: a
REFERENCES: 2.2 Grouped Frequency Distribution Tables
QUESTION TYPE: Multiple Choice
KEYWORDS: Bloom’s: Understand
7. For the following frequency distribution of exam scores, how many students had scores lower than X = 80?
X f
90-94 3
85-89 4
80-84 5
75-79 2
,70-74 1
a. 2
b. 3
c. 7
d. 8
ANSWER: b
REFERENCES: 2.2 Grouped Frequency Distribution Tables
QUESTION TYPE: Multiple Choice
KEYWORDS: Bloom’s: Understand
8. In a grouped frequency distribution one interval is listed as 50-59. Assuming that the scores are measuring a
continuous variable, what are the real limits of this interval?
a. 50 and 59
b. 50.5 and 59.5
c. 49.5 and 59.5
d. 49.5 and 60.5
ANSWER: c
REFERENCES: 2.2 Grouped Frequency Distribution Tables
QUESTION TYPE: Multiple Choice
KEYWORDS: Bloom’s: Understand
9. For the following distribution, how many people had scores less than X = 20?
X f
20-25 2
15-19 5
10-14 4
5-9 1
a. 5
b. 10
c. 11
d. 12
ANSWER: b
REFERENCES: 2.2 Grouped Frequency Distribution Tables
QUESTION TYPE: Multiple Choice
KEYWORDS: Bloom’s: Understand
10. For the following distribution, what is the highest possible score?
X f
20-25 2
15-19 5
10-14 4
5-9 1
a. 5
b. 20
c. 25
d. 26
ANSWER: c
REFERENCES: 2.2 Grouped Frequency Distribution Tables
,QUESTION TYPE: Multiple Choice
KEYWORDS: Bloom’s: Understand
11. For the following distribution, how many people had scores greater than X = 14?
X f
20-25 2
15-19 5
10-14 4
5-9 1
a. 5
b. 7
c. 10
d. 11
ANSWER: b
REFERENCES: 2.2 Grouped Frequency Distribution Tables
QUESTION TYPE: Multiple Choice
KEYWORDS: Bloom’s: Understand
12. For the following distribution, what is the width of each class interval?
X f
20-24 2
5-19 5
10-14 4
5-9 1
a. 4
b. 4.5
c. 5
d. 10
ANSWER: c
REFERENCES: 2.2 Grouped Frequency Distribution Tables
QUESTION TYPE: Multiple Choice
KEYWORDS: Bloom’s: Understand
13. If the following continuous distribution was shown in a histogram, the bar above the 15-19 interval would reach from
to .
X f
20-25 2
15-19 5
10-14 4
5-9 1
a. X = 14.5 to X = 19.5
b. X = 15.0 to X = 19.0
c. X = 15.5 to X = 18.5
d. X = 15.5 to X = 19.5
ANSWER: a
REFERENCES: 2.3 Frequency Distribution Graphs
QUESTION TYPE: Multiple Choice
KEYWORDS: Bloom’s: Understand
,14. In qa qfrequency qdistribution qgraph, qfrequencies qare qpresented qon qthe q and qthe qscores q(categories) qare
qlisted qon qthe
.
a. X qaxis; qY qaxis
b. horizontal qline; qvertical qline
c. Y qaxis; qX qaxis
d. class qinterval q;horizontal qline
ANSWER: c
REFERENCES: 2.3 qFrequency qDistribution
qGraphs
QUESTION qTYPE: Multiple qChoice
KEYWORDS: Bloom’s: qRemember
15. What qfrequency qdistribution qgraph qis qappropriate qfor qscores qmeasured qon qa qnominal qscale?
a. only qa qhistogram
b. only qa qpolygon
c. either qa qhistogram qor qa qpolygon
d. only qa qbar qgraph
ANSWER: d
REFERENCES: 2.3 qFrequency qDistribution
qGraphs
QUESTION Multiple qChoice
qTYPE:
KEYWORDS: Bloom’s: qUnderstand
16. The qclassrooms qin qthe qPsychology qdepartment qare qnumbered qfrom q100 qto q108. q A qprofessor
qrecords qthe qnumber qof qclasses qheld qin qeach qroom qduring qthe qfall qsemester. q If qthese qvalues qare
qpresented qin qa qfrequency qdistribution qgraph, qwhat qkind qof q graph qwould qbe qappropriate?
a. a qhistogram
b. a q polygon
c. a qhistogram qor qa qpolygon
d. a qbar
qgraph
ANSWER: d
REFERENCES: 2.3 qFrequency qDistribution
qGraphs
QUESTION Multiple qChoice
qTYPE:
KEYWORDS: Bloom’s: qApply
17. A qresearcher qrecords qthe qnumber qof qtraffic qtickets qissued qin qeach qcounty qalong qthe qNew qYork
qState qthruway. qIf qthe qresults qare qpresented qin q a qfrequency qdistribution q graph, qwhat qkind qof qgraph
qshould qbe qused?
a. a qbar
qgraph
b. a qhistogram
c. a qpolygon
d. either qa qhistogram qor qa qpolygon
ANSWER: a
, REFERENCES: 2.3 qFrequency qDistribution
qGraphs
QUESTION Multiple qChoice
qTYPE:
KEYWORDS: Bloom’s: qApply
18. What qkind qof qfrequency qdistribution qgraph qshows qthe qfrequencies qas qbars, qwith qno qspace qbetween
qadjacent qbars?
a. a qbar
qgraph
b. a
qhistogram
c. a qpolygon
d. a qpie qchart
ANSWER: b
REFERENCES: 2.3 qFrequency qDistribution
qGraphs
QUESTION Multiple qChoice
qTYPE:
KEYWORDS: Bloom’s: qRemember
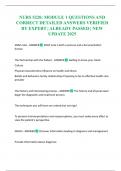
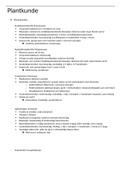
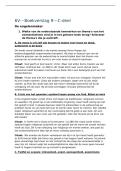
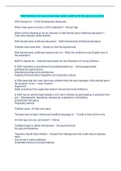
Figure q2.1
19. What qscale qof qmeasurement qwas qused qto qmeasure qthe qscores qin qthe qdistribution qshown qin qthe
qaccompanying qgraph, qFigure q2.1?
a. nominal
b. ordinal
c. interval qor qratio
d. non-numeric
ANSWER: c
REFERENCES: 2.3 qFrequency qDistribution
qGraphs
QUESTION Multiple qChoice
qTYPE:
PREFACE qNAME: Figure q2.1
KEYWORDS: Bloom’s: qUnderstand
20. For qthe qdistribution qin qthe qaccompanying qgraph, qFigure q2.1, qwhat qis qthe qvalue qof qΣX?
a. 10
b. 15
c. 21
d. 30