Chapter 1: OLS & Supplementary Material
1.1 Overview of Classical Linear Regression Model
• Regression model describes and evaluates relationship between given variable (y, dependent)
and one or more other variables (x, independent).
• Correlation: measures degree of linear associated between two variables; treated symmetri-
cally.
• Regression: y is treated differently than x. y is assumed to be random/stochastic, x is
assumed to be fixed/deterministic.
• Main method: Ordinary Least Squares (OLS).
1.2 (Multiple) Regression Model
yt = α + β2 x2t + β3 x3t + . . . + βk xkt + ut
• yt : dependent term
• α: constant/intercept, here x1t = 1
• βj : all slopes with coefficients xj , where βj measures the impact of xji on yt
• ut : error term
Error Term (ut )
• Omitted variables: we cannot capture all determinants of yt .
• Measurement error: there may be error in measurement of yt that cannot be modeled.
• Random external factors: outside influences on yt which we cannot model.
1.3 Data Types
• Cross-sectional data: single point in time across different entities.
yi = α + βxi + ϵi ∀i = 1, . . . , N
• Time-series data: single entity at different points in time.
yt = α + βxy ∀t = 1, . . . , T
• Panel data: cross-sectional and time-series data; multiple entities over several time periods.
yit = α + βxit + ϵit ∀i = 1, . . . , N and t = 1, . . . , T
1.4 Ordinary Least Squares (OLS)
OLS finds the best-fitting line by minimizing the sum of squared residuals between the observed
values and the values predicted by the line
yt = α + βxt + ut
• yt : actual data for observation t.
• ŷt = α̂ + β̂xt : fitted value from regression line.
• ût = yt − ŷt : estimation error; the residual.
1
, PT 2
Choose α and β such that the residual sum of squares (RSS) is minimized, i.e. minimize t=1 ût
T
X T
X T
X
RSS = L = û2t = 2
(yt − ŷt ) = (yt − α̂ − β̂xt )2
t=1 t=1 t=1
Minimizing w.r.t. α̂ and β̂ and solving for α̂ and β̂ gives:
α̂ = ȳ − β̂ x̄
PT
(xt − x̄)(yt − ȳ) σ̂xy
β̂ = t=1 PT = 2
t=1 (xt − x̄)
2 σ̂x
where x̄ and ȳ are the means of the xt and yt values.
OLS requires linearity in the parameters (α and β), this does not necessarily mean linearity in
the variables (x and y).
OLS Assumptions
1. E(ut ) = 0: errors have zero mean.
• Never a problem as long as we include intercept in model.
2. var(ut ) = σ 2 < ∞: errors have constant finite variance for all xt .
• Is alarming for financial data as volatility changes over time, e.g. financial crisis.
3. cov(ui , uj ) = 0: errors are uncorrelated between observations.
• Can be problematic for financial data if model does not account properly for time-
dependence in yt .
4. cov(ut , xt ) = 0: errors and independent variables are uncorrelated.
• Can be an issue when there is endogeneity.
In econometrics, there are quick fixes for (2) and (3), but (4) needs change in estimation methods
(e.g. IV or GMM).
Properties of the OLS Estimator
If assumptions 1-4 hold, the OLS estimator is the Best Linear Unbiased Estimator (BLUE):
• Best: among all linear unbiased estimators, OLS has minimum variance.
Var(b|X) ≥ Var(β̂|X)
• Linear: estimator is linear function of observed data.
• Unbiased: on average, estimated coefficients α̂ and β̂ are the true values of α and β.
• Estimator: α̂ and β̂ are estimators of true parameter values obtained from sample data.
This can be summarized as:
• Unbiased: expected value estimators is equal to true parameter values.
E(α̂) = α and E(β̂) = β
• Consistency: as N increases, OLS estimates converge to true parameter values.
lim α̂ = α and lim β̂ = β
B→∞ B→∞
• Efficiency: estimator has lowest variance among all unbiased estimators; smallest possible
spread around true parameter values.
Then on average, the values of â and β̂ are equal to their true values.
2
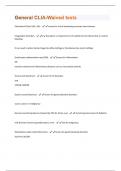
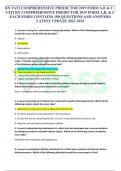
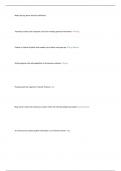
,Figure 1.1: Trade-off Between Bias and Variance. For example, we could have low variance but
high bias, e.g. center of graph is not above true value; this is often a bigger problem than having
higher spread.
Precision and Standard Errors
The (coefficient) standard errors of the OLS estimators α̂ (the intercept) and β̂ (the slope) measure
the precision of these estimates.
s PT s
2
t=1 xt 1
SE(α̂) = s PT SE(β̂) = s PT
T t=1 (xt − x̄)2 t=1 (xt − x̄)2
where s is the estimated standard deviation of the residuals, calculated as:
s
PT 2
t=1 ût
s=
T −2
This tells us how much the estimates α̂ and β̂ vary from their true values based on variability of
the data.
• SE decreases with larger sample size (T ).
• The greater the variation in xt , the smaller the SE.
• More spread in x-values → regression line is better able to fit the data → more accurate
results.
1.5 Statistical Inference - Single Hypothesis
Using the estimates, determine if true value of β has certain value.
H0 : β = β ∗ versus H1 : β ̸= β ∗
This is a two-sided hypothesis.
Significance Test: t-Test
We need extra assumption (5): if error term is normally distributed, then yt is also normally
distributed, and so are the coefficients. So if
ut ∼ N (0, σ 2 )
3
, then
α̂ − α
∼ tT −2
SE(α̂)
β̂ − β
∼ tT −2
SE(β̂
Gives a t distribution with T − 2 degrees of freedom. If the SE are not normally distribution, this
is not an issue as long as T is sufficiently large and all other assumptions hold.
If we have
yt = α + βxt + ut , t = 1, 2, . . . , T
We want to test H0 : β = β ∗ versus H1 : β ̸= β ∗ , then the steps are:
1. Estimate α̂, β̂, SE(α̂), SE(β̂) in the usual way.
2. Calculate the test statistic:
β̂ − β ∗
t=
SE(β̂)
3. Choose significance level; 5%, 10%, 1%. Then a rejection region can then be determined.
4. Use t-tables to obtain critical values with which to compare test statistic.
5. Compare test statistic with critical value to determine if test statistic lies in rejection range.
Errors Hypothesis Testing:
• Type I: reject H0 when true.
• Type II: fail to reject H0 when false.
p-Value: every t-value has a p-value. A null is rejected iff corresponding p-value is smaller than
significance level.
t-Ratio, if we want to test:
H0 : β = 0, H1 = β ̸= 0
Then t-statistic becomes:
β̂
t=
SE(β̂)
which is known as the t-ratio. If the null is rejected, the corresponding variable is significantly
significant.
1.6 Testing Multiple Hypotheses
yt = β1 + β2 x2t + . . . + βk xkt + ut , t = 1, . . . , T
where
1
..
x1 = .
1
y = Xβ + u (matrix form)
4
1.1 Overview of Classical Linear Regression Model
• Regression model describes and evaluates relationship between given variable (y, dependent)
and one or more other variables (x, independent).
• Correlation: measures degree of linear associated between two variables; treated symmetri-
cally.
• Regression: y is treated differently than x. y is assumed to be random/stochastic, x is
assumed to be fixed/deterministic.
• Main method: Ordinary Least Squares (OLS).
1.2 (Multiple) Regression Model
yt = α + β2 x2t + β3 x3t + . . . + βk xkt + ut
• yt : dependent term
• α: constant/intercept, here x1t = 1
• βj : all slopes with coefficients xj , where βj measures the impact of xji on yt
• ut : error term
Error Term (ut )
• Omitted variables: we cannot capture all determinants of yt .
• Measurement error: there may be error in measurement of yt that cannot be modeled.
• Random external factors: outside influences on yt which we cannot model.
1.3 Data Types
• Cross-sectional data: single point in time across different entities.
yi = α + βxi + ϵi ∀i = 1, . . . , N
• Time-series data: single entity at different points in time.
yt = α + βxy ∀t = 1, . . . , T
• Panel data: cross-sectional and time-series data; multiple entities over several time periods.
yit = α + βxit + ϵit ∀i = 1, . . . , N and t = 1, . . . , T
1.4 Ordinary Least Squares (OLS)
OLS finds the best-fitting line by minimizing the sum of squared residuals between the observed
values and the values predicted by the line
yt = α + βxt + ut
• yt : actual data for observation t.
• ŷt = α̂ + β̂xt : fitted value from regression line.
• ût = yt − ŷt : estimation error; the residual.
1
, PT 2
Choose α and β such that the residual sum of squares (RSS) is minimized, i.e. minimize t=1 ût
T
X T
X T
X
RSS = L = û2t = 2
(yt − ŷt ) = (yt − α̂ − β̂xt )2
t=1 t=1 t=1
Minimizing w.r.t. α̂ and β̂ and solving for α̂ and β̂ gives:
α̂ = ȳ − β̂ x̄
PT
(xt − x̄)(yt − ȳ) σ̂xy
β̂ = t=1 PT = 2
t=1 (xt − x̄)
2 σ̂x
where x̄ and ȳ are the means of the xt and yt values.
OLS requires linearity in the parameters (α and β), this does not necessarily mean linearity in
the variables (x and y).
OLS Assumptions
1. E(ut ) = 0: errors have zero mean.
• Never a problem as long as we include intercept in model.
2. var(ut ) = σ 2 < ∞: errors have constant finite variance for all xt .
• Is alarming for financial data as volatility changes over time, e.g. financial crisis.
3. cov(ui , uj ) = 0: errors are uncorrelated between observations.
• Can be problematic for financial data if model does not account properly for time-
dependence in yt .
4. cov(ut , xt ) = 0: errors and independent variables are uncorrelated.
• Can be an issue when there is endogeneity.
In econometrics, there are quick fixes for (2) and (3), but (4) needs change in estimation methods
(e.g. IV or GMM).
Properties of the OLS Estimator
If assumptions 1-4 hold, the OLS estimator is the Best Linear Unbiased Estimator (BLUE):
• Best: among all linear unbiased estimators, OLS has minimum variance.
Var(b|X) ≥ Var(β̂|X)
• Linear: estimator is linear function of observed data.
• Unbiased: on average, estimated coefficients α̂ and β̂ are the true values of α and β.
• Estimator: α̂ and β̂ are estimators of true parameter values obtained from sample data.
This can be summarized as:
• Unbiased: expected value estimators is equal to true parameter values.
E(α̂) = α and E(β̂) = β
• Consistency: as N increases, OLS estimates converge to true parameter values.
lim α̂ = α and lim β̂ = β
B→∞ B→∞
• Efficiency: estimator has lowest variance among all unbiased estimators; smallest possible
spread around true parameter values.
Then on average, the values of â and β̂ are equal to their true values.
2
,Figure 1.1: Trade-off Between Bias and Variance. For example, we could have low variance but
high bias, e.g. center of graph is not above true value; this is often a bigger problem than having
higher spread.
Precision and Standard Errors
The (coefficient) standard errors of the OLS estimators α̂ (the intercept) and β̂ (the slope) measure
the precision of these estimates.
s PT s
2
t=1 xt 1
SE(α̂) = s PT SE(β̂) = s PT
T t=1 (xt − x̄)2 t=1 (xt − x̄)2
where s is the estimated standard deviation of the residuals, calculated as:
s
PT 2
t=1 ût
s=
T −2
This tells us how much the estimates α̂ and β̂ vary from their true values based on variability of
the data.
• SE decreases with larger sample size (T ).
• The greater the variation in xt , the smaller the SE.
• More spread in x-values → regression line is better able to fit the data → more accurate
results.
1.5 Statistical Inference - Single Hypothesis
Using the estimates, determine if true value of β has certain value.
H0 : β = β ∗ versus H1 : β ̸= β ∗
This is a two-sided hypothesis.
Significance Test: t-Test
We need extra assumption (5): if error term is normally distributed, then yt is also normally
distributed, and so are the coefficients. So if
ut ∼ N (0, σ 2 )
3
, then
α̂ − α
∼ tT −2
SE(α̂)
β̂ − β
∼ tT −2
SE(β̂
Gives a t distribution with T − 2 degrees of freedom. If the SE are not normally distribution, this
is not an issue as long as T is sufficiently large and all other assumptions hold.
If we have
yt = α + βxt + ut , t = 1, 2, . . . , T
We want to test H0 : β = β ∗ versus H1 : β ̸= β ∗ , then the steps are:
1. Estimate α̂, β̂, SE(α̂), SE(β̂) in the usual way.
2. Calculate the test statistic:
β̂ − β ∗
t=
SE(β̂)
3. Choose significance level; 5%, 10%, 1%. Then a rejection region can then be determined.
4. Use t-tables to obtain critical values with which to compare test statistic.
5. Compare test statistic with critical value to determine if test statistic lies in rejection range.
Errors Hypothesis Testing:
• Type I: reject H0 when true.
• Type II: fail to reject H0 when false.
p-Value: every t-value has a p-value. A null is rejected iff corresponding p-value is smaller than
significance level.
t-Ratio, if we want to test:
H0 : β = 0, H1 = β ̸= 0
Then t-statistic becomes:
β̂
t=
SE(β̂)
which is known as the t-ratio. If the null is rejected, the corresponding variable is significantly
significant.
1.6 Testing Multiple Hypotheses
yt = β1 + β2 x2t + . . . + βk xkt + ut , t = 1, . . . , T
where
1
..
x1 = .
1
y = Xβ + u (matrix form)
4