Assignments PHM2612
Module 3.0 Descriptive Comparisons
Correct Answers
Complete this quiz on Canvas by or before the due date listed on the class calendar.
Traditionally, students have had issues with this module because of rounding errors. For this
assignment only, you will have up to three (3) attempts to complete the quiz. You are strongly
encouraged to reach out to the teaching team for assistance before you have used your second
and third attempts. Canvas will automatically count the attempt with the highest score towards
your grade. Any attempts that are late will be subject to late penalties and therefore, what may
have originally been your highest score may no longer be the highest score. If your highest
score happens to be late and is still the highest score, the Canvas will count that attempt
towards your grade.
Read each question carefully and answer to the best of your knowledge. You may use this
document to answer the questions prior to submitting your responses on Canvas under the
QUIZZES tab. (42 points)
IMPORTANT! For questions requiring calculations, keep 5 decimal places for intermediate
steps (e.g. XX.XXXXX) and round your final answers to two decimal places (XX.XX), unless
instructed otherwise. If you use an Excel sheet to do these calculations (optional), be sure to
program the formulas according to the rounding instructions provided for each question.
Review the Excel Help document in the Class Resources module. Following the homework
instructions is essential, because otherwise your answer may be incorrect due to a rounding
error. Thus, you may have all your logic correct, but your answer may not match the key in
Canvas and will be graded wrong. If you have trouble understanding these instructions, make
sure you check with your TA to clarify.
This study source was downloaded by 100000897929959 from CourseHero.com on 04-08-2025 08:38:24 GMT -05:00
https://www.coursehero.com/file/243973116/PHM2612-Assignment-30-student-version-2024-Falldocx/
, For the following questions, use the mortality data for Massachusetts and Alaska presented
below (you can consider the population data to be from the midpoint of the year in each
respective state). We have provided an Excel file that is already populated with these mortality
data. We encourage you to use this file to perform the required calculations. If you do so,
remember to check that the data is rounded according to the instructions.
2005 all-cause mortality for Alaska 2005 all-cause mortality for Massachusetts
Age Population Deaths Age Population Deaths
<18 69290 948 <18 795050 13451
18-35 360472 230 18-35 672673 216
36-55 373607 454 36-55 966074 824
56-65 28648 316 56-65 552023 7540
>65 6745 900 >65 27102 2309
Total 838,762 2,848 Total 3,012,922 24,430
1. What is the total number of deaths in Alaska? (1 point)
2848
2. What is the total number of deaths in Massachusetts? (1 point)
24,340
3. What is the total population in Alaska? (1 point)
838,762
4. What is the total population in Massachusetts? (1 point)
3,012,922
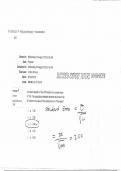
5. Calculate the crude mortality rate per 1,000 persons for each state. Round final answers
to two decimal places. (4 points)
Alaska: 3.40
Massachusetts: 8.08
This study source was downloaded by 100000897929959 from CourseHero.com on 04-08-2025 08:38:24 GMT -05:00
https://www.coursehero.com/file/243973116/PHM2612-Assignment-30-student-version-2024-Falldocx/
Module 3.0 Descriptive Comparisons
Correct Answers
Complete this quiz on Canvas by or before the due date listed on the class calendar.
Traditionally, students have had issues with this module because of rounding errors. For this
assignment only, you will have up to three (3) attempts to complete the quiz. You are strongly
encouraged to reach out to the teaching team for assistance before you have used your second
and third attempts. Canvas will automatically count the attempt with the highest score towards
your grade. Any attempts that are late will be subject to late penalties and therefore, what may
have originally been your highest score may no longer be the highest score. If your highest
score happens to be late and is still the highest score, the Canvas will count that attempt
towards your grade.
Read each question carefully and answer to the best of your knowledge. You may use this
document to answer the questions prior to submitting your responses on Canvas under the
QUIZZES tab. (42 points)
IMPORTANT! For questions requiring calculations, keep 5 decimal places for intermediate
steps (e.g. XX.XXXXX) and round your final answers to two decimal places (XX.XX), unless
instructed otherwise. If you use an Excel sheet to do these calculations (optional), be sure to
program the formulas according to the rounding instructions provided for each question.
Review the Excel Help document in the Class Resources module. Following the homework
instructions is essential, because otherwise your answer may be incorrect due to a rounding
error. Thus, you may have all your logic correct, but your answer may not match the key in
Canvas and will be graded wrong. If you have trouble understanding these instructions, make
sure you check with your TA to clarify.
This study source was downloaded by 100000897929959 from CourseHero.com on 04-08-2025 08:38:24 GMT -05:00
https://www.coursehero.com/file/243973116/PHM2612-Assignment-30-student-version-2024-Falldocx/
, For the following questions, use the mortality data for Massachusetts and Alaska presented
below (you can consider the population data to be from the midpoint of the year in each
respective state). We have provided an Excel file that is already populated with these mortality
data. We encourage you to use this file to perform the required calculations. If you do so,
remember to check that the data is rounded according to the instructions.
2005 all-cause mortality for Alaska 2005 all-cause mortality for Massachusetts
Age Population Deaths Age Population Deaths
<18 69290 948 <18 795050 13451
18-35 360472 230 18-35 672673 216
36-55 373607 454 36-55 966074 824
56-65 28648 316 56-65 552023 7540
>65 6745 900 >65 27102 2309
Total 838,762 2,848 Total 3,012,922 24,430
1. What is the total number of deaths in Alaska? (1 point)
2848
2. What is the total number of deaths in Massachusetts? (1 point)
24,340
3. What is the total population in Alaska? (1 point)
838,762
4. What is the total population in Massachusetts? (1 point)
3,012,922
5. Calculate the crude mortality rate per 1,000 persons for each state. Round final answers
to two decimal places. (4 points)
Alaska: 3.40
Massachusetts: 8.08
This study source was downloaded by 100000897929959 from CourseHero.com on 04-08-2025 08:38:24 GMT -05:00
https://www.coursehero.com/file/243973116/PHM2612-Assignment-30-student-version-2024-Falldocx/