Lecture Notes: Chapter 15 – Externalities
Based on Microeconomics: Canada in the Global Environment (11th Edition)
Introduction
Markets generally do a good job of allocating resources efficiently when buyers and
sellers face all the costs and benefits of their actions. However, when external
effects—called externalities—are present, market outcomes may no longer be
efficient. This chapter examines how externalities arise, how they lead to market
failure, and how society can use tools such as property rights, public policies,
and incentives to restore efficiency. We’ll explore both external costs (negative
externalities) and external benefits (positive externalities), with examples,
graphs, and real-world implications.
1. What Are Externalities?
An externality is a cost or benefit that arises from production or consumption
and affects someone not directly involved in the transaction.
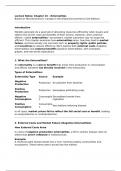
Types of Externalities:
Externality Type Source Example
Negative
Production Air pollution from factories
Production
Positive
Production Honeybees pollinating crops
Production
Negative Consumptio Secondhand smoke from
Consumption n cigarettes
Positive Consumptio
Vaccinations reducing disease
Consumption n
In all cases, market prices fail to reflect the full social cost or benefit, leading
to overproduction or underproduction.
2. External Costs and Market Failure (Negative Externalities)
How External Costs Arise
In cases of negative production externalities, a firm’s actions impose costs on
others that aren’t reflected in market prices.
Example:
A chemical plant dumps waste into a river, harming nearby communities and
ecosystems. These harms aren’t priced into the market.
, Graph Description – Negative Externality (Overproduction)
X-axis: Quantity of output
Y-axis: Price or cost per unit
Demand curve (MB): Downward-sloping, showing marginal benefit to
consumers
Private supply curve (MCₚ): Upward-sloping, reflecting firms’ marginal
private cost
Social cost curve (MCₛ): Lies above MCₚ—includes external costs
Key Points:
Market equilibrium (Qₘ) is where MB = MCₚ
Socially efficient quantity (Qₑ) is where MB = MCₛ
The gap between Qₘ and Qₑ represents overproduction
Deadweight loss (DWL): Triangle between MB and MCₛ curves, from Qₑ to Qₘ
Solutions to Negative Externalities
1. Assigning Property Rights
If affected parties can negotiate and enforce rights, they may reach an efficient
solution. This is known as the Coase Theorem.
Example:
If farmers own the rights to clean water, they can demand compensation or
negotiate reduced pollution levels with the chemical plant.
Limitations:
Transaction costs
Difficulty in identifying and organizing affected parties
2. Pigovian Taxes
A Pigovian tax equals the marginal external cost at the efficient quantity. It
raises the firm’s marginal cost to match the social cost.
Graph Description:
Tax shifts MCₚ up to coincide with MCₛ
Based on Microeconomics: Canada in the Global Environment (11th Edition)
Introduction
Markets generally do a good job of allocating resources efficiently when buyers and
sellers face all the costs and benefits of their actions. However, when external
effects—called externalities—are present, market outcomes may no longer be
efficient. This chapter examines how externalities arise, how they lead to market
failure, and how society can use tools such as property rights, public policies,
and incentives to restore efficiency. We’ll explore both external costs (negative
externalities) and external benefits (positive externalities), with examples,
graphs, and real-world implications.
1. What Are Externalities?
An externality is a cost or benefit that arises from production or consumption
and affects someone not directly involved in the transaction.
Types of Externalities:
Externality Type Source Example
Negative
Production Air pollution from factories
Production
Positive
Production Honeybees pollinating crops
Production
Negative Consumptio Secondhand smoke from
Consumption n cigarettes
Positive Consumptio
Vaccinations reducing disease
Consumption n
In all cases, market prices fail to reflect the full social cost or benefit, leading
to overproduction or underproduction.
2. External Costs and Market Failure (Negative Externalities)
How External Costs Arise
In cases of negative production externalities, a firm’s actions impose costs on
others that aren’t reflected in market prices.
Example:
A chemical plant dumps waste into a river, harming nearby communities and
ecosystems. These harms aren’t priced into the market.
, Graph Description – Negative Externality (Overproduction)
X-axis: Quantity of output
Y-axis: Price or cost per unit
Demand curve (MB): Downward-sloping, showing marginal benefit to
consumers
Private supply curve (MCₚ): Upward-sloping, reflecting firms’ marginal
private cost
Social cost curve (MCₛ): Lies above MCₚ—includes external costs
Key Points:
Market equilibrium (Qₘ) is where MB = MCₚ
Socially efficient quantity (Qₑ) is where MB = MCₛ
The gap between Qₘ and Qₑ represents overproduction
Deadweight loss (DWL): Triangle between MB and MCₛ curves, from Qₑ to Qₘ
Solutions to Negative Externalities
1. Assigning Property Rights
If affected parties can negotiate and enforce rights, they may reach an efficient
solution. This is known as the Coase Theorem.
Example:
If farmers own the rights to clean water, they can demand compensation or
negotiate reduced pollution levels with the chemical plant.
Limitations:
Transaction costs
Difficulty in identifying and organizing affected parties
2. Pigovian Taxes
A Pigovian tax equals the marginal external cost at the efficient quantity. It
raises the firm’s marginal cost to match the social cost.
Graph Description:
Tax shifts MCₚ up to coincide with MCₛ