Lecture Notes: Chapter 6 – Government Action in Markets
Based on Microeconomics: Canada in the Global Environment (11th Edition)
Introduction
Governments often intervene in markets to achieve social, political, or economic objectives.
While well-intentioned, these actions can lead to unintended consequences such as shortages,
surpluses, inefficiencies, and black markets. This chapter examines five major types of
government intervention: rent ceilings, minimum wage laws, taxation, production quotas and
subsidies, and markets for illegal goods. Using real-world examples and clear graph
descriptions, we explore how these policies affect prices, quantities, efficiency, and equity in the
marketplace.
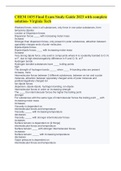
1. Rent Ceilings and Housing Shortages
A rent ceiling is a government-imposed maximum price that can be charged for rental housing,
set below the market equilibrium.
Graph Description:
X-axis: Quantity of housing (units rented)
Y-axis: Rent (price per month)
Demand curve: Downward sloping (lower rent → more renters want apartments)
Supply curve: Upward sloping (higher rent → more landlords offer housing)
Equilibrium: Where demand equals supply (market rent)
Rent ceiling: Horizontal line below equilibrium price
Effect of a Rent Ceiling:
1. Housing Shortage: At the rent ceiling, quantity demanded exceeds quantity supplied.
Fewer landlords are willing to rent, while more people want housing.
2. Inefficient Allocation: Apartments are not necessarily rented to those who value them
most.
3. Wasted Time and Resources: Renters spend time searching or waiting for apartments.
4. Black Markets: Under-the-table payments emerge to bypass the legal ceiling.
Example:
In cities like New York or Toronto, rent control policies have led to severe housing shortages,
with long waiting lists and under-the-table arrangements.
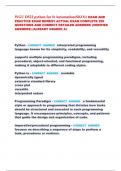
, 2. Minimum Wage Laws and Unemployment
A minimum wage is a government-imposed legal floor on the price of labor, set above the
market equilibrium wage.
Graph Description:
X-axis: Quantity of labor (number of workers)
Y-axis: Wage rate
Demand for labor: Downward sloping (firms hire fewer workers at higher wages)
Supply of labor: Upward sloping (more people are willing to work at higher wages)
Equilibrium wage: Where labor supply equals labor demand
Minimum wage line: Horizontal line above equilibrium wage
Effect of a Minimum Wage:
1. Unemployment: Quantity of labor supplied exceeds quantity demanded → surplus of
labor (unemployment).
2. Inefficient Employment: Jobs may go to less qualified workers due to discrimination or
informal hiring practices.
3. Increased Costs for Firms: May lead to higher prices or automation.
Example:
If the market wage for entry-level work is $13/hour and the government sets a minimum wage at
$16/hour, some employers may reduce hiring, creating a surplus of labor (i.e., unemployment
among low-skilled workers).
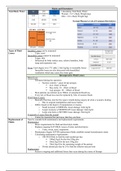
3. The Effects of a Tax
A tax on a good or service raises its price and affects both buyers and sellers. It can be levied on
consumers or producers, but who bears the burden depends on elasticity.
Graph Description:
X-axis: Quantity of the good
Y-axis: Price
Demand curve: Downward sloping
Supply curve: Upward sloping
Equilibrium: Initial price and quantity where supply = demand
Tax wedge: Vertical gap between what buyers pay and what sellers receive
Effect of a Tax:
1. Higher Price for Buyers: Price paid increases.
Based on Microeconomics: Canada in the Global Environment (11th Edition)
Introduction
Governments often intervene in markets to achieve social, political, or economic objectives.
While well-intentioned, these actions can lead to unintended consequences such as shortages,
surpluses, inefficiencies, and black markets. This chapter examines five major types of
government intervention: rent ceilings, minimum wage laws, taxation, production quotas and
subsidies, and markets for illegal goods. Using real-world examples and clear graph
descriptions, we explore how these policies affect prices, quantities, efficiency, and equity in the
marketplace.
1. Rent Ceilings and Housing Shortages
A rent ceiling is a government-imposed maximum price that can be charged for rental housing,
set below the market equilibrium.
Graph Description:
X-axis: Quantity of housing (units rented)
Y-axis: Rent (price per month)
Demand curve: Downward sloping (lower rent → more renters want apartments)
Supply curve: Upward sloping (higher rent → more landlords offer housing)
Equilibrium: Where demand equals supply (market rent)
Rent ceiling: Horizontal line below equilibrium price
Effect of a Rent Ceiling:
1. Housing Shortage: At the rent ceiling, quantity demanded exceeds quantity supplied.
Fewer landlords are willing to rent, while more people want housing.
2. Inefficient Allocation: Apartments are not necessarily rented to those who value them
most.
3. Wasted Time and Resources: Renters spend time searching or waiting for apartments.
4. Black Markets: Under-the-table payments emerge to bypass the legal ceiling.
Example:
In cities like New York or Toronto, rent control policies have led to severe housing shortages,
with long waiting lists and under-the-table arrangements.
, 2. Minimum Wage Laws and Unemployment
A minimum wage is a government-imposed legal floor on the price of labor, set above the
market equilibrium wage.
Graph Description:
X-axis: Quantity of labor (number of workers)
Y-axis: Wage rate
Demand for labor: Downward sloping (firms hire fewer workers at higher wages)
Supply of labor: Upward sloping (more people are willing to work at higher wages)
Equilibrium wage: Where labor supply equals labor demand
Minimum wage line: Horizontal line above equilibrium wage
Effect of a Minimum Wage:
1. Unemployment: Quantity of labor supplied exceeds quantity demanded → surplus of
labor (unemployment).
2. Inefficient Employment: Jobs may go to less qualified workers due to discrimination or
informal hiring practices.
3. Increased Costs for Firms: May lead to higher prices or automation.
Example:
If the market wage for entry-level work is $13/hour and the government sets a minimum wage at
$16/hour, some employers may reduce hiring, creating a surplus of labor (i.e., unemployment
among low-skilled workers).
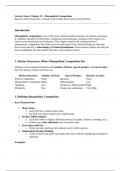
3. The Effects of a Tax
A tax on a good or service raises its price and affects both buyers and sellers. It can be levied on
consumers or producers, but who bears the burden depends on elasticity.
Graph Description:
X-axis: Quantity of the good
Y-axis: Price
Demand curve: Downward sloping
Supply curve: Upward sloping
Equilibrium: Initial price and quantity where supply = demand
Tax wedge: Vertical gap between what buyers pay and what sellers receive
Effect of a Tax:
1. Higher Price for Buyers: Price paid increases.