Lecture Notes: Chapter 2 – The Economic Problem
Based on Microeconomics: Canada in the Global Environment, 11th Edition
Introduction
Scarcity is the central issue in economics: resources are limited, but human wants are unlimited.
As a result, every society must make choices about what to produce, how to produce it, and for
whom. This chapter introduces the Production Possibilities Frontier (PPF) as a key visual tool
to understand opportunity cost, efficiency, and trade. We’ll also explore how trade and
specialization expand economic possibilities, how today's choices shape tomorrow’s
opportunities, and how economic institutions coordinate complex decisions.
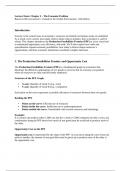
1. The Production Possibilities Frontier and Opportunity Cost
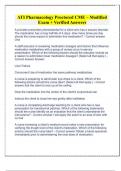
The Production Possibilities Frontier (PPF) is a fundamental graph in economics that
illustrates the different combinations of two goods or services that an economy can produce
when all resources are fully and efficiently employed.
Structure of the PPF Graph
X-axis: Quantity of Good A (e.g., Cars)
Y-axis: Quantity of Good B (e.g., Computers)
Each point on the curve represents a possible allocation of resources between these two goods.
Reading the PPF
Points on the curve: Efficient use of resources
Points inside the curve: Inefficient use or underemployment
Points outside the curve: Unattainable with current resources and technology
Example:
If a country can produce either 1,000 cars (on the x-axis) or 5,000 computers (on the y-axis), any
combination along the PPF shows how much of one good must be sacrificed to produce more of
the other.
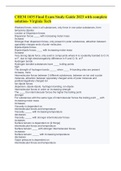
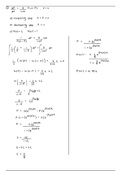
Opportunity Cost on the PPF
Opportunity cost is represented by the slope of the PPF. As you move along the curve from one
point to another, the amount of one good that must be given up to produce more of the other is
the opportunity cost.
, Example:
Moving from Point A (500 cars and 2,000 computers) to Point B (600 cars and 1,600 computers)
means gaining 100 cars but losing 400 computers. The opportunity cost of each additional car is
4 computers.
The curve is concave to the origin because resources are not equally efficient in all uses, making
the opportunity cost rise as production shifts from one good to the other.
2. Production Possibilities vs. Preferences and Efficient Allocation
While the PPF shows what an economy can produce, it does not indicate what it should produce.
That depends on preferences—the desires and values of consumers and society.
Production Possibilities vs. Preferences
The PPF outlines the boundary of feasible production.
Preferences determine which point along that curve is most desirable.
Example:
If Canadians strongly prefer healthcare over sports cars, the optimal point on the PPF will favor
more hospitals (plotted on the y-axis) and fewer cars (x-axis), even though multiple
combinations are possible.
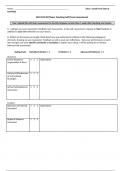
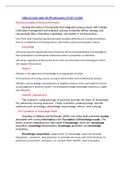
Allocative Efficiency
An efficient allocation of resources happens when the economy produces the combination of
goods and services that provides the greatest benefit to society.
This is the point on the PPF where:
Marginal Benefit (MB) = Marginal Cost (MC)
Graph Description:
X-axis: Quantity of Good A (e.g., environmental protection)
Y-axis: Quantity of Good B (e.g., consumer goods)
Efficient allocation occurs where the slope of the PPF (representing MC) equals the slope
of the indifference curve (representing MB).
Example:
Allocative efficiency would suggest spending on healthcare up to the point where society values
an additional unit of health services just as much as it costs to produce that unit.
Based on Microeconomics: Canada in the Global Environment, 11th Edition
Introduction
Scarcity is the central issue in economics: resources are limited, but human wants are unlimited.
As a result, every society must make choices about what to produce, how to produce it, and for
whom. This chapter introduces the Production Possibilities Frontier (PPF) as a key visual tool
to understand opportunity cost, efficiency, and trade. We’ll also explore how trade and
specialization expand economic possibilities, how today's choices shape tomorrow’s
opportunities, and how economic institutions coordinate complex decisions.
1. The Production Possibilities Frontier and Opportunity Cost
The Production Possibilities Frontier (PPF) is a fundamental graph in economics that
illustrates the different combinations of two goods or services that an economy can produce
when all resources are fully and efficiently employed.
Structure of the PPF Graph
X-axis: Quantity of Good A (e.g., Cars)
Y-axis: Quantity of Good B (e.g., Computers)
Each point on the curve represents a possible allocation of resources between these two goods.
Reading the PPF
Points on the curve: Efficient use of resources
Points inside the curve: Inefficient use or underemployment
Points outside the curve: Unattainable with current resources and technology
Example:
If a country can produce either 1,000 cars (on the x-axis) or 5,000 computers (on the y-axis), any
combination along the PPF shows how much of one good must be sacrificed to produce more of
the other.
Opportunity Cost on the PPF
Opportunity cost is represented by the slope of the PPF. As you move along the curve from one
point to another, the amount of one good that must be given up to produce more of the other is
the opportunity cost.
, Example:
Moving from Point A (500 cars and 2,000 computers) to Point B (600 cars and 1,600 computers)
means gaining 100 cars but losing 400 computers. The opportunity cost of each additional car is
4 computers.
The curve is concave to the origin because resources are not equally efficient in all uses, making
the opportunity cost rise as production shifts from one good to the other.
2. Production Possibilities vs. Preferences and Efficient Allocation
While the PPF shows what an economy can produce, it does not indicate what it should produce.
That depends on preferences—the desires and values of consumers and society.
Production Possibilities vs. Preferences
The PPF outlines the boundary of feasible production.
Preferences determine which point along that curve is most desirable.
Example:
If Canadians strongly prefer healthcare over sports cars, the optimal point on the PPF will favor
more hospitals (plotted on the y-axis) and fewer cars (x-axis), even though multiple
combinations are possible.
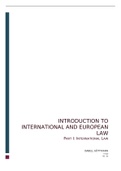
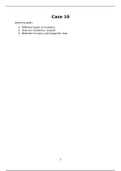
Allocative Efficiency
An efficient allocation of resources happens when the economy produces the combination of
goods and services that provides the greatest benefit to society.
This is the point on the PPF where:
Marginal Benefit (MB) = Marginal Cost (MC)
Graph Description:
X-axis: Quantity of Good A (e.g., environmental protection)
Y-axis: Quantity of Good B (e.g., consumer goods)
Efficient allocation occurs where the slope of the PPF (representing MC) equals the slope
of the indifference curve (representing MB).
Example:
Allocative efficiency would suggest spending on healthcare up to the point where society values
an additional unit of health services just as much as it costs to produce that unit.