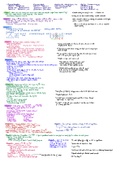
Biostatistics
Population: Entire group that researchers aim to generalize their findings to
Sample: Subset of population selected to conduct the observation or analysis
● Goal: Accurately represent characteristics of the population
Parameter: numerical characteristic of a population
● Denoted by greek letters
Statistic: numerical characteristic of a sample
● Denoted by Latin letters
● Used to make inferences about population parameters
Population → Random sample → Sample → Statistic → Inferences → Parameter
Independent Variable: Intervention
Dependent Variable: Outcome caused by independent variable
Control Variable: Variables that may influence the dependent variable whose conditions are
held constant
Confounding Variable: Factors that cannot/have not been controlled that may influence both
the independent and dependent variable
● Forget about a variable that has an effect on the outcome
● Influences independent and dependent
Qualitative Data: Meaningful information collected in words
Quantitative Data: Data collected as numerical or countable information
● Can be further described as continuous or discrete
Continuous (scale) data: Logical order with values that increase or decrease by the same unit or
amount
● Interval data: No meaningful zero
○ Cannot say one value is “twice” as much as another, lacks a true zero
● Ratio data: Meaningful zero
○ One value can be “twice” as much as another, has a true zero, can compare values
○ True absence of quantity measured
, Discrete (categorical) data:
● Nominal data: order of categories is based on random choice
● Ordinal data: Categories ranked in logical order
The main quantitative data types are continuous and discrete
Counts (frequencies): number of observations in each group
Proportions (percentages): number in group/total
The simplest form of a visualization/representation of data is a frequency table
Measures of central tendency
● Mean: The average of a set of values
○ Continuous data that is normally distributed
● Median: The value that is in the middle
○ Continuous data that is not normally distributed or ordinal data
● Mode: The value that appears most frequently
○ Nominal data
Spread of Data:
● Range: Highest - Lowest
● Interquartile Range: Describes the values that lie in the middle 50% of the distribution
● Variance: Average squared distance of values from their mean
● Standard Deviation: The square root of variance which indicates to what degree data is
dispersed away from the mean
● Coefficient of variation: SD/mean
Summarizing Data
● Nominal
○ Visual summaries: Bar chart, pie chart
○ Numeric summaries: Frequency tables, counts, percentages
● Ordinal
○ Visual summaries: Bar chart, pie chart
○ Numerical summaries: Frequency tables, median and IQR
● Continuous Data
○ Visual summaries: Box and whisker plots, histogram
○ Numerical summaries: Mean and SD, median and IQR
Standard Normal Distribution