paypal / buymeacoffee
Statistics 3
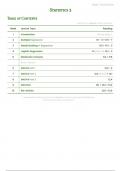
Table of Contents
reading from Agresti, unless specified ↴
Week Lecture Topic Reading
1 Introduction Revise Stats 2
2 Multiple Regression 11.1 - 3 + 11.6 - 7
3 Model Building in Regression 11.5 + 14.1 - 3
4 Logistic Regression 14 (M&M) + 15.1 - 3
5 Moderator Analysis 11.4 + 11.5
Exam Season
6 ANOVA Part 1 12.2 - 4
7 ANOVA Part 2 12.2 (M&M) + 12.1
8 ANOVA Part 3 12.4
9 ANCOVA 13.1 + 13.2 + 13.4
10 RM-ANOVA 12.5 + 12.6
I appreciate and thank you for any donation; all this money will (probably) go
toward staying alive at this point :)
, paypal / buymeacoffee
Lecture 1 - Introduction
- statistical methods help us determine the factors that explain variability among subjects
- scores on any variable are not the same for each person → they vary
↳ we aim to explain (part of) the variance in the scores → what makes the scores differ?
research design
- research studies can have different purposes:
1. describing the data → descriptive statistics, plots, etc.
2. making the best possible prediction → build the best prediction model
↳ e.g., chat GPT
3. answering a predefined research question → inferential statistics (stats 3)
↳ using a sample to generalize research results to a population
- examples of predefined research questions
do males differ from females in their mean worry scores?
does age influence worry scores?
- it is crucial to operationalize all our variables before collecting the data
↳ operationalization → defining how we measure the variables of interest
→ we also need to specify whether the variable is categorical or continuous
→ for accurate results, use validated and reliable measurement instruments
-❗the way we measure the variables determines which statistical methods can be used
- linear models can be used in almost all situations
↳ regardless of the number of variables or categories → we can use dummy variables
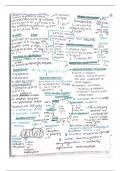
models and statistics
what is a model?
→ a representation of reality
→ captures the essential and ignores the rest (noise)
- models are the foundation of statistics
↳ most common models are linear models → 𝑌 = 𝑏0 + 𝑏1𝑋1 + 𝑏2𝑋2 +... + 𝑒
- statistics is the process of building and evaluating models
↳ not very good at evaluating models or determining whether a model fits well
→ however, statistics is very good at telling which of 2 (nested) models fits better
- all traditional tests (e.g., t-test, ANOVA, regression) can be reformulated as model
comparisons → model comparison approach
↳ model comparison can do more than traditional tests and also prevent P-hacking
, paypal / buymeacoffee
model comparison
- the idea of model comparison is to fit 2 different nested models and compare them
nested models → all terms of a smaller model are also included in a larger model
↳ e.g., model 1 → 𝑦 = 𝑏0 + 𝑏1𝑥1
model 2 → 𝑦 = 𝑏0 + 𝑏1𝑥1 + 𝑏2𝑥2 (the only difference is 𝑏2𝑥2)
- in model comparison, we are interested in:
→ how much does the fit improve if 𝑏2𝑥2 is included in the model, beyond what’s already
in the model
→ whether it is worth keeping the additional predictor(s)
→ whether the fit improves enough to justify the added complexity
- examples
1. can variation be explained by differences in gender?
↳ we can test this with
→ two-sample t-test
→ ANOVA (2 groups)
→ simple linear regression with one dummy for gender
or we can use model comparison:
model 1 → 𝑦 = 𝑏0
model 2 → 𝑦 = 𝑏0 + 𝑏1𝐺𝐸𝑁𝐷𝐸𝑅
↳ we ask ‘is the difference between models significant?’
2. if we know the gender, do age differences explain (additional) variation?
↳ controlled for gender, we can test this with
→ multiple regression model
→ ANCOVA
or we can use model comparison
model 1 → 𝑦 = 𝑏0 + 𝑏1𝐺𝐸𝑁𝐷𝐸𝑅 (add b1GENDER to control for gender)
model 2 → 𝑦 = 𝑏0 + 𝑏1𝐺𝐸𝑁𝐷𝐸𝑅 + 𝑏2𝐴𝐺𝐸
→ analog for controlling for age
3. if we know both age and gender, does having a child and the age
of the oldest child explain (additional) variance?
↳ this can’t be tested with traditional tests
→ we can only test whether bparent = 0 or bage child = 0 but
not both at the same time (are the slopes significant?)
, paypal / buymeacoffee
↳ however, we can test it using model comparison
model 1 → 𝑦 = 𝑏0 + 𝑏1𝐴𝐺𝐸 + 𝑏2𝐺𝐸𝑁𝐷𝐸𝑅
model 2 → 𝑦 = 𝑏0 + 𝑏1𝐴𝐺𝐸 + 𝑏2𝐺𝐸𝑁𝐷𝐸𝑅 + 𝑏3𝑃𝐴𝑅𝐸𝑁𝑇 + 𝑏4𝐴𝐺𝐸𝐶𝐻𝐼𝐿𝐷
↳ we find a P-value for the increase in explained variation based on both variables
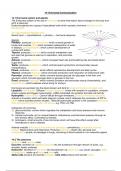
P-values and P-hacking
P-value → the probability of obtaining results at least as extreme as the observed result, given
that the null hypothesis is correct
↳ we assume the same, fixed sample size, drawn from the same population
- we need to follow strict rules to apply and interpret P-values:
1. only compute one P-value
→ calculating multiple P-values increases the probability of making a type I error
→ we can only use more if we make corrections (e.g., Bonferroni)
2. the assumptions must be met
3. the sample size must be specified in advance
→ don’t collect additional data if the P-value doesn’t align with your expectations
P-hacking → running multiple tests on the same data and reporting only the significant results
- P-values reveal only whether there is an effect or not → nothing else that is useful
- to discover how large the effect is:
1. estimation
→ inspect means, SD, correlations, effect sizes, CIs
→ if needed, use Bonferroni corrections
2. graphical analysis
3. model comparison
→ help us keep the number of P-values low
4. Bayesian statistics
→ limitation: difficult to use
Statistics 3
Table of Contents
reading from Agresti, unless specified ↴
Week Lecture Topic Reading
1 Introduction Revise Stats 2
2 Multiple Regression 11.1 - 3 + 11.6 - 7
3 Model Building in Regression 11.5 + 14.1 - 3
4 Logistic Regression 14 (M&M) + 15.1 - 3
5 Moderator Analysis 11.4 + 11.5
Exam Season
6 ANOVA Part 1 12.2 - 4
7 ANOVA Part 2 12.2 (M&M) + 12.1
8 ANOVA Part 3 12.4
9 ANCOVA 13.1 + 13.2 + 13.4
10 RM-ANOVA 12.5 + 12.6
I appreciate and thank you for any donation; all this money will (probably) go
toward staying alive at this point :)
, paypal / buymeacoffee
Lecture 1 - Introduction
- statistical methods help us determine the factors that explain variability among subjects
- scores on any variable are not the same for each person → they vary
↳ we aim to explain (part of) the variance in the scores → what makes the scores differ?
research design
- research studies can have different purposes:
1. describing the data → descriptive statistics, plots, etc.
2. making the best possible prediction → build the best prediction model
↳ e.g., chat GPT
3. answering a predefined research question → inferential statistics (stats 3)
↳ using a sample to generalize research results to a population
- examples of predefined research questions
do males differ from females in their mean worry scores?
does age influence worry scores?
- it is crucial to operationalize all our variables before collecting the data
↳ operationalization → defining how we measure the variables of interest
→ we also need to specify whether the variable is categorical or continuous
→ for accurate results, use validated and reliable measurement instruments
-❗the way we measure the variables determines which statistical methods can be used
- linear models can be used in almost all situations
↳ regardless of the number of variables or categories → we can use dummy variables
models and statistics
what is a model?
→ a representation of reality
→ captures the essential and ignores the rest (noise)
- models are the foundation of statistics
↳ most common models are linear models → 𝑌 = 𝑏0 + 𝑏1𝑋1 + 𝑏2𝑋2 +... + 𝑒
- statistics is the process of building and evaluating models
↳ not very good at evaluating models or determining whether a model fits well
→ however, statistics is very good at telling which of 2 (nested) models fits better
- all traditional tests (e.g., t-test, ANOVA, regression) can be reformulated as model
comparisons → model comparison approach
↳ model comparison can do more than traditional tests and also prevent P-hacking
, paypal / buymeacoffee
model comparison
- the idea of model comparison is to fit 2 different nested models and compare them
nested models → all terms of a smaller model are also included in a larger model
↳ e.g., model 1 → 𝑦 = 𝑏0 + 𝑏1𝑥1
model 2 → 𝑦 = 𝑏0 + 𝑏1𝑥1 + 𝑏2𝑥2 (the only difference is 𝑏2𝑥2)
- in model comparison, we are interested in:
→ how much does the fit improve if 𝑏2𝑥2 is included in the model, beyond what’s already
in the model
→ whether it is worth keeping the additional predictor(s)
→ whether the fit improves enough to justify the added complexity
- examples
1. can variation be explained by differences in gender?
↳ we can test this with
→ two-sample t-test
→ ANOVA (2 groups)
→ simple linear regression with one dummy for gender
or we can use model comparison:
model 1 → 𝑦 = 𝑏0
model 2 → 𝑦 = 𝑏0 + 𝑏1𝐺𝐸𝑁𝐷𝐸𝑅
↳ we ask ‘is the difference between models significant?’
2. if we know the gender, do age differences explain (additional) variation?
↳ controlled for gender, we can test this with
→ multiple regression model
→ ANCOVA
or we can use model comparison
model 1 → 𝑦 = 𝑏0 + 𝑏1𝐺𝐸𝑁𝐷𝐸𝑅 (add b1GENDER to control for gender)
model 2 → 𝑦 = 𝑏0 + 𝑏1𝐺𝐸𝑁𝐷𝐸𝑅 + 𝑏2𝐴𝐺𝐸
→ analog for controlling for age
3. if we know both age and gender, does having a child and the age
of the oldest child explain (additional) variance?
↳ this can’t be tested with traditional tests
→ we can only test whether bparent = 0 or bage child = 0 but
not both at the same time (are the slopes significant?)
, paypal / buymeacoffee
↳ however, we can test it using model comparison
model 1 → 𝑦 = 𝑏0 + 𝑏1𝐴𝐺𝐸 + 𝑏2𝐺𝐸𝑁𝐷𝐸𝑅
model 2 → 𝑦 = 𝑏0 + 𝑏1𝐴𝐺𝐸 + 𝑏2𝐺𝐸𝑁𝐷𝐸𝑅 + 𝑏3𝑃𝐴𝑅𝐸𝑁𝑇 + 𝑏4𝐴𝐺𝐸𝐶𝐻𝐼𝐿𝐷
↳ we find a P-value for the increase in explained variation based on both variables
P-values and P-hacking
P-value → the probability of obtaining results at least as extreme as the observed result, given
that the null hypothesis is correct
↳ we assume the same, fixed sample size, drawn from the same population
- we need to follow strict rules to apply and interpret P-values:
1. only compute one P-value
→ calculating multiple P-values increases the probability of making a type I error
→ we can only use more if we make corrections (e.g., Bonferroni)
2. the assumptions must be met
3. the sample size must be specified in advance
→ don’t collect additional data if the P-value doesn’t align with your expectations
P-hacking → running multiple tests on the same data and reporting only the significant results
- P-values reveal only whether there is an effect or not → nothing else that is useful
- to discover how large the effect is:
1. estimation
→ inspect means, SD, correlations, effect sizes, CIs
→ if needed, use Bonferroni corrections
2. graphical analysis
3. model comparison
→ help us keep the number of P-values low
4. Bayesian statistics
→ limitation: difficult to use