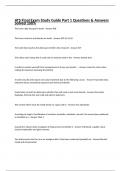
One-way Anova Factorial Anova Regression Regr. com
Analysis of Variance Moderation in Anova Basic Regression Med
How two groups differ from each other How two groups differ from each other for 1. Checks which variables actually have When a variable no
two variables an effect on OV and its direction effect (moderation
ANOVA statistically examines how much of A causes B,
What does it measure?
2. How much is that effect? (quantitative
the variability in our outcome variable can be Adds another PV to one-way Anova
explained by our predictor variable.
relationship between PV an OV
We will find 3 effects:
It breaks down different measures of 3. Which factors have the high effects,
main effect of variable A
variability through calculating sums of hence being most important? Effect of the PV on
main effect of variable B
squares. interaction effect of A and B Effect of the Med
helps us test if the mean scores of the Remaining direct
groups are statistically different Predict OV value through PV values
OV → c’-path or “
ANOVA: how much variance can be For a good model we want the error
Two measurements of variability: explained by our independent variable. (SSresidual) to be as small as
The effect of the P
Variance = the average of the squared Factorial ANOVA: how much of the possible!
or “total effect”.
differences from the mean variance in our data can be explained by 1 PV = Simple Regression
C=
Sum of squares = the sum of the our independent variableS (>1). 1 or more PV = Multiple Regression
We basically perform
squared differences
several times.
Variables
PV: Categorical, with more than 2 groups PV: 2+ Categorical variables, with more PV: Quantitative (categorical with dummy)
than 2 groups
OV: Quantitative OV: Quantitative OV: Quantitative
Variance is homogenous across Variance is homogenous across
groups-> Levene Test groups-> Levene Test
Prerequisites
Residuals are normally distributed –in Residuals are normally distributed –in
Necessary
this class we don’t test for this. this class we don’t test for this.
Groups are roughly equally sized –in this Groups are roughly equally sized –in this
class they always are. class they always are.
Our subjects can only be in one group Our subjects can only be in one group
(between subjects design). (between subjects design).
Sum of squares: Sum of squares: Sum of squares
The variability in our data in a part that Total variability is same as Anova. SS SStotal = same as ANOVA
can be explained by our model (between total and SS residual are the same. SStotal = SSmodel + SSresidual
SS model is divided in 3: