AU MATH140: Quantitative Reasoning - Exam 2
d d d d d d d
questions with answers [verified] d d d
Individuals - d d
d d d d d d d d d d d d d d d subjects on which data is collected d d d d d
- DONT CHANGE
d d
Variables - d d
Any measurable conditions, events, characteristics, or behaviors that are controlled or
d d d d d d d d d d d d d d d d d d d d d d d d d d
observed in a study. d d d
- CAN CHANGE
d d
- QUALITATIVE (colors etc) or QUANTITATIVE (#/ amount)
d d d d d d d
explanatory variable (independent variable) - d d d d d
d d d d d d d d d d d d d d d Help explain what causes the dependent variable
d d d d d d
- one event NOT rely on other
d d d d d d d
-present on x-axis - affected by stimulus
d d d d d d
**Time = ALWAYS on x-axis d d d d
response variable (dependent variable) -d d d d d
d d d d d d d d d d d d d d d A variable that results or changes due to the experimental variable(independent)
d d d d d d d d d d
- after one event occurs it CHANGES probability of next event
d d d d d d d d d d
-present on y-axis d d
slope - d d
measure of the steepness of a line on a graph, equal to its vertical change divided by its
d d d d d d d d d d d d d d d d d d d d d d d d d d d d d d d d d
horizontal change d
m=y2-y1/x2-x1
Mean - d d
d d d d d d d d d d d d d d d Average of a distribution d d d
1|Page
,1. Add the data points
d d d d
2. divide by the number of data points
d d d d d d d
(x₁+x₂+x₃...)/n = value d d
Median - d d
d d d d d d d d d d d d d d d Middle data point in a distribution; half the scores are above it and half are below it
d d d d d d d d d d d d d d d d
-EVEN # of data points→ add 2 middle values and divide by 2
d d d d d d d d d d d d
Mode - d d
d d d d d d d d d d d d d d d Most frequently occurring data points(s) in a distribution
d d d d d d d
Distribution - d d
d d d d d d d d d d d d d d d The trend of an arrangement of ALL data points
d d d d d d d d
Frequency distribution - d d d
d d d d d d d d d d d d d d d an arrangement of data that indicates how often a particular score or observation occurs
d d d d d d d d d d d d d
- all values organized into non-overlapping classes with # of times data points are in each class
d d d d d d d d d d d d d d d d
Ex. Handednessd d
R & L = class; Frequency = # of individuals w/ RorL
d d d d d d d d d d d
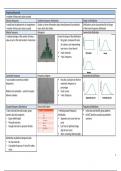
RIGHT skewed distribution - d d d d
d d d d d d d d d d d d d d d Histogram has a longer tail of data toward the RIGHT side
d d d d d d d d d d
LEFT skewed distribution -
d d d d
d d d d d d d d d d d d d d d Histogram has a longer tail of data toward the LEFT side
d d d d d d d d d d
Symmetric distribution - d d d
vertical line could be drawn at any point on histogram and both L&R sides are mirror
d d d d d d d d d d d d d d d d d d d d d d d d d d d d d d d
images of eachother d d
Multi-modal distribution - d d d
2|Page
, d d d d d d d d d d d d d d d Histogram has multiple peaks of data throughout the distribution
d d d d d d d d
-bi, tri, multi d d
5 Number summary -
d d d d
d d d d d d d d d d d d d d d 1. minimum (lowest value)
d d d
2. Q1(lower quartile)
d d
3. median (middle)
d d
4. Q3 (upper quartile)
d d d
5. maximum (highest value)
d d d
Quartiles (Q₁ & Q₃) - d d d d d
d d d d d d d d d d d d d d d Medians of the lower and upper halves of data points.
d d d d d d d d d d
1. order data points Least → Greatest
d d d d d d
2. split data set into 2 halves @ median
d d d d d d d d
3. Q₁= median of lower & Q₃= median of upper
d d d d d d d d d
stem-and-leaf plot (stemplot) - d d d d
d d d d d d d d d d d d d d d Display of distribution of data d d d d
- Stem = all but final digit
d d d d d d
- Leaf = final digit of each data point
d d d d d d d d
1. order values least→greatest
d d d
2. assemble stem and assign leaves
d d d d d
Dot Plot - d d d
a graphical display that summarizes data by the number of dots above each data value on
d d d d d d d d d d d d d d d d d d d d d d d d d d d d d d
d the horizontal axis
d d
Histogram - d d
Graphical representation of a frequency distribution for a single numerical variable/ set of
d d d d d d d d d d d d d d d d d d d d d d d d d d d
d data points d
- bars drawn with intervals
d d d d d
3|Page
d d d d d d d
questions with answers [verified] d d d
Individuals - d d
d d d d d d d d d d d d d d d subjects on which data is collected d d d d d
- DONT CHANGE
d d
Variables - d d
Any measurable conditions, events, characteristics, or behaviors that are controlled or
d d d d d d d d d d d d d d d d d d d d d d d d d d
observed in a study. d d d
- CAN CHANGE
d d
- QUALITATIVE (colors etc) or QUANTITATIVE (#/ amount)
d d d d d d d
explanatory variable (independent variable) - d d d d d
d d d d d d d d d d d d d d d Help explain what causes the dependent variable
d d d d d d
- one event NOT rely on other
d d d d d d d
-present on x-axis - affected by stimulus
d d d d d d
**Time = ALWAYS on x-axis d d d d
response variable (dependent variable) -d d d d d
d d d d d d d d d d d d d d d A variable that results or changes due to the experimental variable(independent)
d d d d d d d d d d
- after one event occurs it CHANGES probability of next event
d d d d d d d d d d
-present on y-axis d d
slope - d d
measure of the steepness of a line on a graph, equal to its vertical change divided by its
d d d d d d d d d d d d d d d d d d d d d d d d d d d d d d d d d
horizontal change d
m=y2-y1/x2-x1
Mean - d d
d d d d d d d d d d d d d d d Average of a distribution d d d
1|Page
,1. Add the data points
d d d d
2. divide by the number of data points
d d d d d d d
(x₁+x₂+x₃...)/n = value d d
Median - d d
d d d d d d d d d d d d d d d Middle data point in a distribution; half the scores are above it and half are below it
d d d d d d d d d d d d d d d d
-EVEN # of data points→ add 2 middle values and divide by 2
d d d d d d d d d d d d
Mode - d d
d d d d d d d d d d d d d d d Most frequently occurring data points(s) in a distribution
d d d d d d d
Distribution - d d
d d d d d d d d d d d d d d d The trend of an arrangement of ALL data points
d d d d d d d d
Frequency distribution - d d d
d d d d d d d d d d d d d d d an arrangement of data that indicates how often a particular score or observation occurs
d d d d d d d d d d d d d
- all values organized into non-overlapping classes with # of times data points are in each class
d d d d d d d d d d d d d d d d
Ex. Handednessd d
R & L = class; Frequency = # of individuals w/ RorL
d d d d d d d d d d d
RIGHT skewed distribution - d d d d
d d d d d d d d d d d d d d d Histogram has a longer tail of data toward the RIGHT side
d d d d d d d d d d
LEFT skewed distribution -
d d d d
d d d d d d d d d d d d d d d Histogram has a longer tail of data toward the LEFT side
d d d d d d d d d d
Symmetric distribution - d d d
vertical line could be drawn at any point on histogram and both L&R sides are mirror
d d d d d d d d d d d d d d d d d d d d d d d d d d d d d d d
images of eachother d d
Multi-modal distribution - d d d
2|Page
, d d d d d d d d d d d d d d d Histogram has multiple peaks of data throughout the distribution
d d d d d d d d
-bi, tri, multi d d
5 Number summary -
d d d d
d d d d d d d d d d d d d d d 1. minimum (lowest value)
d d d
2. Q1(lower quartile)
d d
3. median (middle)
d d
4. Q3 (upper quartile)
d d d
5. maximum (highest value)
d d d
Quartiles (Q₁ & Q₃) - d d d d d
d d d d d d d d d d d d d d d Medians of the lower and upper halves of data points.
d d d d d d d d d d
1. order data points Least → Greatest
d d d d d d
2. split data set into 2 halves @ median
d d d d d d d d
3. Q₁= median of lower & Q₃= median of upper
d d d d d d d d d
stem-and-leaf plot (stemplot) - d d d d
d d d d d d d d d d d d d d d Display of distribution of data d d d d
- Stem = all but final digit
d d d d d d
- Leaf = final digit of each data point
d d d d d d d d
1. order values least→greatest
d d d
2. assemble stem and assign leaves
d d d d d
Dot Plot - d d d
a graphical display that summarizes data by the number of dots above each data value on
d d d d d d d d d d d d d d d d d d d d d d d d d d d d d d
d the horizontal axis
d d
Histogram - d d
Graphical representation of a frequency distribution for a single numerical variable/ set of
d d d d d d d d d d d d d d d d d d d d d d d d d d d
d data points d
- bars drawn with intervals
d d d d d
3|Page