Demand
Market: a group of producers and consumers who exchange a good service for payment
● Competitive market: market w/many buyers + sellers of the same good/service
○ No individual actions have noticeable effect on price
○ Behavior described by SUPPLY + DEMAND MODEL
**LAW OF DEMAND: there is an indirect realtionship between demand and price and quantity
supplied
Occurs due to:
1. Substitution effect
2. Income effect
3. Law of diminsihing marginal utility
● Demand schedule: table showing how much of a good/service consumers want to buy at
diff prices
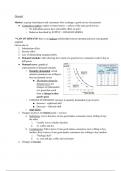
● Demand curve: graphical
representation of demand schedule
○ Quantity demanded: actual
amount consumers are willing to
buy (on demand curve)
■ Movements along the
demand curve are
changes in Qdemanded
of a good that result
from a change in that
good's price
○ CHANGE IN DEMAND: increase in quantity demanded @ given price
■ Increase = rightward shift
■ Decrease = leftward shift
○ SHIFTERS:
1. Changes in prices of related goods + services
a. Substitutes: rise in the price of one good makes consumers more willing to buy
the other
i. Usually serve a similar function
ii. ex. coffee and tea
b. Complements: Fall in price of one good makes consumers more willing to buy
another. Rise in price of one good makes consumers less willing to buy another.
i. "Package deal"
ii. ex. cars and gas, coffee and croissants
2. Changes in income
, a. Normal goods: demand inc. when consumer income inc
i. Most goods
b. Inferior goods: demand dec. when income rises
i. Less desirable than expensive alternatives
ii. ex. chauffeur v. taxi
3. Changes in tastes
a. Fads, trends, beliefs, cultural shifts
4. Changes in expectations
a. When consumers have choice of when to purchase, current demand is affected by
expectations of future price.
i. ex. people shop during seasonal sales, stock up before prices are marked
up again, investing strategically
5. Changes in # of customers (population)
a. If each individual consumer's demand is unchanged, proportionally, demand
expands
b. Individual demand curve: relationship between Qd + price
i. MARKET DEMAND CURVE = HORIZONTAL SUM OF INDIVID
DEMAND CURVES OF ALL CONSUMERS
Supply
**LAW OF SUPPLY: there is a direct realtionship between price and quantity supplied
● Quantity supplied: quantity producers are willing to produce + sell
● Supply schedule: shows Qgood producers are willing to sell at different prices
○ Supply curve: represents points on supply
schedule
■ Movements along supply curve:
changes in quantity supplied resulting
from change in price
■ Change in supply: shift of supply
curve due to change in supply
schedule
● Increase = shift right
● Decrease = shift left
● SHIFTERS:
1. Change in input prices
a. Increase in input $ →
production of final good is most costly → DECREASE in supply
b. Decrease in input # → production of final good is cheaper →
INCREASE in supply
2. Changes in prices of related goods/services
, a. Single producers prod. mix of goods
i. Supply less gas when the heating oil price rises (more profit
to be found in producing heating oil)
1. Shifts gas supply curve left
b. Substitutes in production: require the same inputs, production of
one negates the others
c. Complements in production: by-products in production
3. Changes in tech
a. Better tech = reduction of prod. cost = supply increases
4. Changes in expectations
a. Storage: time between production + selling
i. ex. oil refineries store gas in spring before demand
increases in summer
ii. Comparison of current $ vs. future expected price
1. FALL ANTICIPATED IN FUTURE PRICE = INC
IN SUPPLY TODAY
5. Changes in # of producers
a. Individual supply curve: relationship btwn quantity supplied +
price for an individual producer
b. Market supply curve: combined total quantity supplied by all
individs
(horizontal sum)
6. Gov't action: taxes and
subsidies
a. Subsidies =
increase, positive
incentive
b. Taxes = decrease,
negative incentive
Supply, Demand, and Equilibrium
Equilibrium: no consumers can be better off
by doing something different
● Quantity demanded = quantity supplied
Market price: the price all sellers and buyers pay
Surplus: excess supply quantity—at a price above the equilibrium price, consumers are only
willing to buy so much (too expensive)
Market: a group of producers and consumers who exchange a good service for payment
● Competitive market: market w/many buyers + sellers of the same good/service
○ No individual actions have noticeable effect on price
○ Behavior described by SUPPLY + DEMAND MODEL
**LAW OF DEMAND: there is an indirect realtionship between demand and price and quantity
supplied
Occurs due to:
1. Substitution effect
2. Income effect
3. Law of diminsihing marginal utility
● Demand schedule: table showing how much of a good/service consumers want to buy at
diff prices
● Demand curve: graphical
representation of demand schedule
○ Quantity demanded: actual
amount consumers are willing to
buy (on demand curve)
■ Movements along the
demand curve are
changes in Qdemanded
of a good that result
from a change in that
good's price
○ CHANGE IN DEMAND: increase in quantity demanded @ given price
■ Increase = rightward shift
■ Decrease = leftward shift
○ SHIFTERS:
1. Changes in prices of related goods + services
a. Substitutes: rise in the price of one good makes consumers more willing to buy
the other
i. Usually serve a similar function
ii. ex. coffee and tea
b. Complements: Fall in price of one good makes consumers more willing to buy
another. Rise in price of one good makes consumers less willing to buy another.
i. "Package deal"
ii. ex. cars and gas, coffee and croissants
2. Changes in income
, a. Normal goods: demand inc. when consumer income inc
i. Most goods
b. Inferior goods: demand dec. when income rises
i. Less desirable than expensive alternatives
ii. ex. chauffeur v. taxi
3. Changes in tastes
a. Fads, trends, beliefs, cultural shifts
4. Changes in expectations
a. When consumers have choice of when to purchase, current demand is affected by
expectations of future price.
i. ex. people shop during seasonal sales, stock up before prices are marked
up again, investing strategically
5. Changes in # of customers (population)
a. If each individual consumer's demand is unchanged, proportionally, demand
expands
b. Individual demand curve: relationship between Qd + price
i. MARKET DEMAND CURVE = HORIZONTAL SUM OF INDIVID
DEMAND CURVES OF ALL CONSUMERS
Supply
**LAW OF SUPPLY: there is a direct realtionship between price and quantity supplied
● Quantity supplied: quantity producers are willing to produce + sell
● Supply schedule: shows Qgood producers are willing to sell at different prices
○ Supply curve: represents points on supply
schedule
■ Movements along supply curve:
changes in quantity supplied resulting
from change in price
■ Change in supply: shift of supply
curve due to change in supply
schedule
● Increase = shift right
● Decrease = shift left
● SHIFTERS:
1. Change in input prices
a. Increase in input $ →
production of final good is most costly → DECREASE in supply
b. Decrease in input # → production of final good is cheaper →
INCREASE in supply
2. Changes in prices of related goods/services
, a. Single producers prod. mix of goods
i. Supply less gas when the heating oil price rises (more profit
to be found in producing heating oil)
1. Shifts gas supply curve left
b. Substitutes in production: require the same inputs, production of
one negates the others
c. Complements in production: by-products in production
3. Changes in tech
a. Better tech = reduction of prod. cost = supply increases
4. Changes in expectations
a. Storage: time between production + selling
i. ex. oil refineries store gas in spring before demand
increases in summer
ii. Comparison of current $ vs. future expected price
1. FALL ANTICIPATED IN FUTURE PRICE = INC
IN SUPPLY TODAY
5. Changes in # of producers
a. Individual supply curve: relationship btwn quantity supplied +
price for an individual producer
b. Market supply curve: combined total quantity supplied by all
individs
(horizontal sum)
6. Gov't action: taxes and
subsidies
a. Subsidies =
increase, positive
incentive
b. Taxes = decrease,
negative incentive
Supply, Demand, and Equilibrium
Equilibrium: no consumers can be better off
by doing something different
● Quantity demanded = quantity supplied
Market price: the price all sellers and buyers pay
Surplus: excess supply quantity—at a price above the equilibrium price, consumers are only
willing to buy so much (too expensive)