PEARSON EDEXCEL GCE A LEVEL FURTHER MATHEMATICS 9FMO/4D PAPER 4D MERGED
QUESTION PAPER AND MARKING SCHEME
■ ■
Further Mathematics
Advanced
PAPER 4D: Decision Mathematics 2
Mathematical Formulae and Statistical Tables (Green), calculator, Decision
Mathematics Answer Book (enclosed)
Candidates may use any calculator allowed by Pearson regulations.
Calculators must not have the facility for symbolic algebra manipulation,
differentiation and integration, or have retrievable mathematical
formulae stored in them.
Instructions
•• Use black ink or ball‑point pen.
• Write
If pencil is used for diagrams/sketches/graphs it must be dark (HB or B).
your answers for this paper in the Decision Mathematics answer book
• Fill
provided.
in the boxes at the top of the answer book with your name, centre number
and candidate number.
•• Do not return the question paper with the answer book.
Answer all questions and ensure that your answers to parts of questions are
• Answer
clearly labelled.
the questions in the answer book provided
• You
– there may be more space than you need.
should show sufficient working to make your methods clear.
• Inexact
Answers without working may not gain full credit.
answers should be given to three significant figures unless
otherwise stated.
Information
•• AThere
booklet ‘Mathematical Formulae and Statistical Tables’ is provided.
• The are 8 questions in this question paper. The total mark for this paper is 75.
marks for each question are shown in brackets
– use this as a guide as to how much time to spend on each question.
Advice
• Read each question carefully before you start to answer it.
•• Try to answer every question.
Check your answers if you have time at the end. Turn over
P72803A
©2024 Pearson Education Ltd.
F:1/1/1/1/1/
,1.
C1
A 2 2 E
x 15 8 17
13 11
13 13
12 12 B 19 7 D 5 5
S T
4
7 10 4
15 5 y
10 12 4 16
16
C 11 8 F
C1
Figure 1
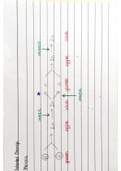
Figure 1 shows a capacitated, directed network of pipes. The numbers in circles
represent an initial flow from S to T. The other number on each arc represents the
capacity, in litres per second, of the corresponding pipe.
(a) (i) State the value of x
(ii) State the value of y
(2)
(b) State the value of the initial flow.
(1)
(c) State the capacity of cut C1
(1)
(d) Find, by inspection, a flow‑augmenting route to increase the flow by four units.
You must state your route.
(1)
The flow‑augmenting route from (d) is used to increase the flow from S to T.
(e) Prove that the flow is now maximal.
(3)
A vertex restriction is now applied so that no more than 12 litres per second can flow
through E.
(f) (i) Complete Diagram 1 in the answer book to show this restriction.
(ii) State the value of the maximum flow through the network with this restriction.
(2)
(Total for Question 1 is 10 marks)
2 P72803A
■■■■
,2. The general solution of the first order recurrence relation
un+1 + aun = bn2 + cn + d n 0
is given by
un = A(3)n + 5n2 + 1
where A is an arbitrary non‑zero constant.
By considering expressions for un+1 and un , find the values of the constants a, b, c and d.
(Total for Question 2 is 3 marks)
P72803A 3
■■■■ Turn over
, 3. The table below shows the cost, in pounds, of transporting one unit of stock from each
of four supply points, E, F, G and H, to three sales points, A, B and C. It also shows the
stock held at each supply point and the amount required at each sales point.
A minimum cost solution is required.
A B C Supply
E 23 28 22 21
F 26 19 29 32
G 29 24 20 29
H 24 26 19 23
Demand 45 19 23
(a) Explain why it is necessary to add a dummy demand point.
(1)
(b) On Table 1 in the answer book, insert appropriate values in the dummy demand
column, D.
(1)
After finding an initial feasible solution and applying one iteration of the stepping‑stone
method, the table becomes
A B C D
E 21
F 19 13
G 6 23
H 5 18
(c) Starting with GD as the next entering cell, perform two further iterations of the
stepping‑stone method to obtain an improved solution. You must make your method
clear by showing your routes and stating the
• shadow costs
• improvement indices
• entering and exiting cells
(6)
(d) State the cost of the solution found in (c).
(1)
(e) Determine whether the solution obtained in (c) is optimal, giving a reason for
your answer.
(3)
(Total for Question 3 is 12 marks)
4 P72803A
■■■■
QUESTION PAPER AND MARKING SCHEME
■ ■
Further Mathematics
Advanced
PAPER 4D: Decision Mathematics 2
Mathematical Formulae and Statistical Tables (Green), calculator, Decision
Mathematics Answer Book (enclosed)
Candidates may use any calculator allowed by Pearson regulations.
Calculators must not have the facility for symbolic algebra manipulation,
differentiation and integration, or have retrievable mathematical
formulae stored in them.
Instructions
•• Use black ink or ball‑point pen.
• Write
If pencil is used for diagrams/sketches/graphs it must be dark (HB or B).
your answers for this paper in the Decision Mathematics answer book
• Fill
provided.
in the boxes at the top of the answer book with your name, centre number
and candidate number.
•• Do not return the question paper with the answer book.
Answer all questions and ensure that your answers to parts of questions are
• Answer
clearly labelled.
the questions in the answer book provided
• You
– there may be more space than you need.
should show sufficient working to make your methods clear.
• Inexact
Answers without working may not gain full credit.
answers should be given to three significant figures unless
otherwise stated.
Information
•• AThere
booklet ‘Mathematical Formulae and Statistical Tables’ is provided.
• The are 8 questions in this question paper. The total mark for this paper is 75.
marks for each question are shown in brackets
– use this as a guide as to how much time to spend on each question.
Advice
• Read each question carefully before you start to answer it.
•• Try to answer every question.
Check your answers if you have time at the end. Turn over
P72803A
©2024 Pearson Education Ltd.
F:1/1/1/1/1/
,1.
C1
A 2 2 E
x 15 8 17
13 11
13 13
12 12 B 19 7 D 5 5
S T
4
7 10 4
15 5 y
10 12 4 16
16
C 11 8 F
C1
Figure 1
Figure 1 shows a capacitated, directed network of pipes. The numbers in circles
represent an initial flow from S to T. The other number on each arc represents the
capacity, in litres per second, of the corresponding pipe.
(a) (i) State the value of x
(ii) State the value of y
(2)
(b) State the value of the initial flow.
(1)
(c) State the capacity of cut C1
(1)
(d) Find, by inspection, a flow‑augmenting route to increase the flow by four units.
You must state your route.
(1)
The flow‑augmenting route from (d) is used to increase the flow from S to T.
(e) Prove that the flow is now maximal.
(3)
A vertex restriction is now applied so that no more than 12 litres per second can flow
through E.
(f) (i) Complete Diagram 1 in the answer book to show this restriction.
(ii) State the value of the maximum flow through the network with this restriction.
(2)
(Total for Question 1 is 10 marks)
2 P72803A
■■■■
,2. The general solution of the first order recurrence relation
un+1 + aun = bn2 + cn + d n 0
is given by
un = A(3)n + 5n2 + 1
where A is an arbitrary non‑zero constant.
By considering expressions for un+1 and un , find the values of the constants a, b, c and d.
(Total for Question 2 is 3 marks)
P72803A 3
■■■■ Turn over
, 3. The table below shows the cost, in pounds, of transporting one unit of stock from each
of four supply points, E, F, G and H, to three sales points, A, B and C. It also shows the
stock held at each supply point and the amount required at each sales point.
A minimum cost solution is required.
A B C Supply
E 23 28 22 21
F 26 19 29 32
G 29 24 20 29
H 24 26 19 23
Demand 45 19 23
(a) Explain why it is necessary to add a dummy demand point.
(1)
(b) On Table 1 in the answer book, insert appropriate values in the dummy demand
column, D.
(1)
After finding an initial feasible solution and applying one iteration of the stepping‑stone
method, the table becomes
A B C D
E 21
F 19 13
G 6 23
H 5 18
(c) Starting with GD as the next entering cell, perform two further iterations of the
stepping‑stone method to obtain an improved solution. You must make your method
clear by showing your routes and stating the
• shadow costs
• improvement indices
• entering and exiting cells
(6)
(d) State the cost of the solution found in (c).
(1)
(e) Determine whether the solution obtained in (c) is optimal, giving a reason for
your answer.
(3)
(Total for Question 3 is 12 marks)
4 P72803A
■■■■