Bio250 Exam 2025 Questions with Accurate
Solutions
In the simple Simploid environment where the only limitation is space which of the following
life-history changes would be most likely to help a mutant "win" (aka be more successful)?
Becoming more fecund
The wild-type SimPloids become reproductively mature much later than mutant SimPloids, so
the mutant SimPloids effectively have more offspring in the same amount of time. How might
delaying reproduction allow wild-type Simploids to do as well as the mutants over the long
term?
If wild-type Simploids are less vulnerable to predation than adult mutants
All organisms face trade-offs that arise from the constraints that they face. One example of a
constraint: Energy spent on one task cannot be spent on another. Which of the
following best illustrates a realistic life-history trade-off?
Invest in growth and survival or invest in reproductive output
Which of the following statements about life-history is true?
An example of a life-history trait is the typical life span of an individual.
Experiments show that if kestrels laid slightly larger clutches they could fledge chicks during a
single reproductive bout. According to the data collected, why do kestrels lay slightly smaller
clutches.
Parents save energy feeding smaller clutches thus are more likely to survive and reproduce
again
An unsuccessful life-history strategy would be associated with populations that:
decrease in size over time
If a population has a per capita growth rate, r, of -0.15, which statement is true?
, its birth rate is less than its death rate
A researcher is tracking an isolate population of bears. Over 3 year the population had 250
births and 170 deaths. The average population size over this period was 440 individuals.
What is the approximate per capita growth rate, r, of this population over this time period?
(See answer for formula to use but solve problem on your own)
r= births - deaths/tNavg
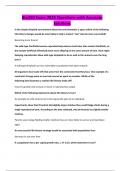
The age pyramid below shows the age structure of a "mystery" population's size and age
structure are stable over time. Which statement below about this population fecundity and
mortality rates is most likely true?
It's fecundity and mortality are both high
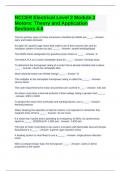
Below is a simplified life table for a hypothetical population of endangered black-footed
ferrets (Mustela nigripes). What is the generation time, G, for this population? (See answer
for equation but solve on your own)
G= Σ xlxmx/R0 (aka lxmx)
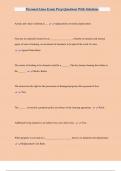
A life table for a small freshwater fish native to a river in China is shown below. Based on this
table, what can you say about the population? (Hint: Review the equation for the net
reproductive rate[ R0= Σ lxmx ])
The population size is not changing because R0= 1
Imagine a population of a species that has a life span of 20 years and a population growth
rate, r, of 0.9. Which of the following would lead to an increase in a population's per capita
growth rate, r?
Females having offspring sooner, which would decrease generation time, G
Survivorship curves show how survivorship changes with age for members of a population.
These curves can be characterized as Type 1, Type 2, or Type 3. Which statement below about
survivorship curves?
Solutions
In the simple Simploid environment where the only limitation is space which of the following
life-history changes would be most likely to help a mutant "win" (aka be more successful)?
Becoming more fecund
The wild-type SimPloids become reproductively mature much later than mutant SimPloids, so
the mutant SimPloids effectively have more offspring in the same amount of time. How might
delaying reproduction allow wild-type Simploids to do as well as the mutants over the long
term?
If wild-type Simploids are less vulnerable to predation than adult mutants
All organisms face trade-offs that arise from the constraints that they face. One example of a
constraint: Energy spent on one task cannot be spent on another. Which of the
following best illustrates a realistic life-history trade-off?
Invest in growth and survival or invest in reproductive output
Which of the following statements about life-history is true?
An example of a life-history trait is the typical life span of an individual.
Experiments show that if kestrels laid slightly larger clutches they could fledge chicks during a
single reproductive bout. According to the data collected, why do kestrels lay slightly smaller
clutches.
Parents save energy feeding smaller clutches thus are more likely to survive and reproduce
again
An unsuccessful life-history strategy would be associated with populations that:
decrease in size over time
If a population has a per capita growth rate, r, of -0.15, which statement is true?
, its birth rate is less than its death rate
A researcher is tracking an isolate population of bears. Over 3 year the population had 250
births and 170 deaths. The average population size over this period was 440 individuals.
What is the approximate per capita growth rate, r, of this population over this time period?
(See answer for formula to use but solve problem on your own)
r= births - deaths/tNavg
The age pyramid below shows the age structure of a "mystery" population's size and age
structure are stable over time. Which statement below about this population fecundity and
mortality rates is most likely true?
It's fecundity and mortality are both high
Below is a simplified life table for a hypothetical population of endangered black-footed
ferrets (Mustela nigripes). What is the generation time, G, for this population? (See answer
for equation but solve on your own)
G= Σ xlxmx/R0 (aka lxmx)
A life table for a small freshwater fish native to a river in China is shown below. Based on this
table, what can you say about the population? (Hint: Review the equation for the net
reproductive rate[ R0= Σ lxmx ])
The population size is not changing because R0= 1
Imagine a population of a species that has a life span of 20 years and a population growth
rate, r, of 0.9. Which of the following would lead to an increase in a population's per capita
growth rate, r?
Females having offspring sooner, which would decrease generation time, G
Survivorship curves show how survivorship changes with age for members of a population.
These curves can be characterized as Type 1, Type 2, or Type 3. Which statement below about
survivorship curves?