Introduction to Science
EXERCISE 1: DATA INTERPRETATION
Dissolved oxygen is oxygen that is trapped in a fluid. Since many living organisms require
oxygen to survive, it is a necessary component of water systems (streams, lakes, rivers, etc.).
Dissolved oxygen is measured in units of parts per million (ppm). Examine the data in Table 4,
which shows the amount of dissolved oxygen present in a body of water and the number of fish
observed in the sample. Then, answer the questions below.
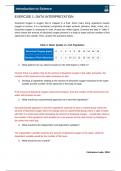
Table 4: Water Quality vs. Fish Population
Dissolved Oxygen (ppm) 0 2 4 6 8 10 12 14 16 18
Number of Fish Observed 0 1 3 10 12 13 15 10 12 13
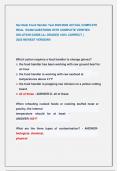
1. What patterns do you observe based on the information in Table 4?
Overall, there is a pattern that as the amount of dissolved oxygen in the water increases, the
number of fish observed in the water increases as well.
2. Develop a hypothesis relating to the amount of dissolved oxygen measured in the water
sample and the number of fish observed in the body of water.
If the amount of dissolved oxygen measured increases, then the number of fish observed in the
water will increase as well.
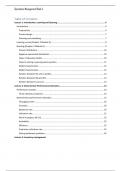
3. What would your experimental approach be to test this hypothesis?
My experimental approach to test this hypothesis would be to have a control group where the
amount of dissolved oxygen does not change and an experimental group where a spot of water
with fish in it would exist while increasing the amount of dissolved oxygen. I would then observe
the number of fish spotted in each location for a set amount of time and record my findings at
the same time each day.
4. What would be the independent and dependent variables?
The independent variable would be the amount of dissolved oxygen in the water, while the
dependent variable would be the number of fish seen.
5. What would be your control?
©eScience Labs, 2018
, Introduction to Science
My control group would be an amount of water with zero dissolved oxygen and zero fish.
©eScience Labs, 2018
EXERCISE 1: DATA INTERPRETATION
Dissolved oxygen is oxygen that is trapped in a fluid. Since many living organisms require
oxygen to survive, it is a necessary component of water systems (streams, lakes, rivers, etc.).
Dissolved oxygen is measured in units of parts per million (ppm). Examine the data in Table 4,
which shows the amount of dissolved oxygen present in a body of water and the number of fish
observed in the sample. Then, answer the questions below.
Table 4: Water Quality vs. Fish Population
Dissolved Oxygen (ppm) 0 2 4 6 8 10 12 14 16 18
Number of Fish Observed 0 1 3 10 12 13 15 10 12 13
1. What patterns do you observe based on the information in Table 4?
Overall, there is a pattern that as the amount of dissolved oxygen in the water increases, the
number of fish observed in the water increases as well.
2. Develop a hypothesis relating to the amount of dissolved oxygen measured in the water
sample and the number of fish observed in the body of water.
If the amount of dissolved oxygen measured increases, then the number of fish observed in the
water will increase as well.
3. What would your experimental approach be to test this hypothesis?
My experimental approach to test this hypothesis would be to have a control group where the
amount of dissolved oxygen does not change and an experimental group where a spot of water
with fish in it would exist while increasing the amount of dissolved oxygen. I would then observe
the number of fish spotted in each location for a set amount of time and record my findings at
the same time each day.
4. What would be the independent and dependent variables?
The independent variable would be the amount of dissolved oxygen in the water, while the
dependent variable would be the number of fish seen.
5. What would be your control?
©eScience Labs, 2018
, Introduction to Science
My control group would be an amount of water with zero dissolved oxygen and zero fish.
©eScience Labs, 2018