Besanko &Braeutigam – Microeconomics, 5th edition
il il il il il il Solutions Manual il
Chapter1 il
AnalyzingEconomicProblems il il
Solutions to Review Questions il il il
1. What is the difference between microeconomics and macroeconomics? il il il il il il il
Microeconomics studies the economic behavior ofindividualeconomic decision makers, suchas a il il il il il il il il il il il il
consumer, a worker, a firm, or a manager. Macroeconomics studies how an entire national
il il il il il il il il i l il il il il il
economy performs, examining such topics as the aggregate levels of income and employment, the
il il il il il il il il il il il il il il
levels of interest rates and prices, the rate of inflation, and the nature of business cycles.
il il il il il il il il il il il il il il il il
2. Why is economics often described as the science of constrained choice?
il il il il il il il il il il
While our wants for goods and services are unlimited, the resources necessary to produce those
il il il il il il il il il il il il il il
goods and services, such as labor, managerial talent, capital, and raw materials, are “scarce” because
il il il il il il il il il il il il il il il
their supply is limited. This scarcity implies that we are constrained in the choices we can make
il il il il i l il il il il il il il il il il il il
about which goods and services to produce. Thus, economics is often described as the science of
il il il il il il il i l il il il il il il il il
constrained choice.
il il
3. How does thetool of constrained optimization help decision makers make choices? il il il il il il il il il il il
What roles do the objective function and constraints play in a model of constrained
il il il il il il il il il il il il il il
optimization?
il
Constrained optimization allows the decision maker to select the best (optimal) alternative while il il il il il il il il il il il il
accounting for any possible limitations or restrictions on the choices. The objective function
il il il il il il il il il il i l il il
represents the relationship to be maximized or minimized. For example, a firm‟s profit might be the
il il il il il il il il i l il il il il il il il
objective function and all choices will be evaluated in the profit function to determine which yields
il il il il il il il il il il il il il il il il
the highest profit. The constraints place limitations on the choice the decision maker can select and
il il il i l il il il il il il il il il il il il
defines the set of alternatives from which the best will be chosen.
il il il il il il il il il il il il
4. Suppose the market forwheat is competitive, with an upward-sloping supply curve, a il il il il il il il il il il il il
downward-sloping demand curve, and an equilibrium price of $4.00 per bushel. Why would a
il il il il il il il il il il il il il il
higher price (e.g., $5.00 per bushel) not be an equilibrium price? Why would a lower price
il il il il il il il il il il il il il il il il
(e.g., $2.50 per bushel) not be an equilibrium price?
il il il il il il il il il
If the price in the market was above the equilibrium price, consumers would be willing to purchase
il il il il il il il il il il il il il il il il
fewer units than suppliers would be willing to sell, creating an excess supply. As suppliers realize
il il il il il il il il il il il il il i l il il
theyare not selling the units they have made available, sellers will bid down the
il il il il il il il il il il il il il il il
Copyright © 2014 John Wiley& Sons, Inc. il il il il il il il Chapter 1 - 1 il il il
,Besanko &Braeutigam – Microeconomics, 5th edition il il il il il il Solutions Manual il
price to entice more consumers to purchase their goods or services. By definition, equilibrium is a
il il il il il il il il il il i l il il il il
state that will remain unchanged as long as exogenous factors remain unchanged. Since in this case
il il il il il il il il il il il il i l il il il
suppliers will lower their price, this high price cannot be an equilibrium.
il il il il il il il il il il il il
When the price is below the equilibrium price, consumers will demand more units than suppliers have
il il il il il il il il il il il il il il il
made available. This excess demand will entice consumers to bid up the prices to purchase the
il il i l il il il il il il il il il il il il il
limited units available. Since the price will change, it cannot be an equilibrium.
il il il i l il il il il il il il il il
5. What isthe difference between an exogenous variable and an endogenous variable in il il il il il il il il il il il il
an economic model? Would it ever be useful to construct a model that contained only
il il il il il il il il il il il il il il il
exogenous variables (and no endogenous variables)?
il il il il il il
Exogenous variables are taken as given in an economic model, i.e., theyare determined by some il il il il il il il il il il il il il il il
process outside the model, while endogenous variables are determined within the economic model
il il il il il il il il il il il il il
being studied.
il il
An economic model that contained no endogenous variables would not be very interesting. With no
il il il il il il il il il il il il i l il
endogenous variables, nothing would be determined by the model so it would not serve much
il il il il il il il il il il il il il il il
purpose.
il
6. Why do economists do comparative statics analysis? What role do endogenous il il il il il il il il il il
variables and exogenous variables play in comparative statics analysis?
il il il il il il il il il
Comparative statics analyses are performed to determine how the levels of endogenous variables il il il il il il il il il il il il
change as some exogenous variable is changed. This type of analysis is very important since in the
il il il il il il il i l il il il il il il il il il
real world the exogenous variables, such as weather, policy tools, etc. are always changing and it is
il il il il il il il il il il il il il il il il il
useful to know how changes in these variables affect the levels of other, endogenous, variables. An
il il il il il il il il il il il il il il il i l
example of comparative statics analysis would be asking the question: If extraordinarily low rainfall
il il il il il il il il il il il il il il
(an exogenous variable) causes a 30 percent reduction in corn supply, by how much will the market
il il il il il il il il il il il il il il il il il
price for corn (an endogenous variable) increase?
il il il il il il il
7. What isthe difference between positive and normative analysis? Which of the il il il il il il il il il il il
following questions would entail positive analysis, and which normative analysis?
il il il il il il il il il il
a) What effect will Internet auction companieshave on the profits of local automobile
il il il il il il il il il il il il
dealerships?
il
b) Should the government impose special taxes on sales of merchandise made over the il il il il il il il il il il il il
Internet?
il
Positive analysis attempts to explain how an economic system works or to predict how it will change
il il il il il il il il il il il il il il il il
over time byasking explanatoryor predictive questions. Normative analysis focuses on what should
il il il il il il il il i l il il il il il
be done by asking prescriptive questions.
il il il il il il
Copyright © 2014 John Wiley& Sons, Inc. il il il il il il il Chapter 1 - 2 il il il
,Besanko &Braeutigam – Microeconomics, 5th edition
il il il il il il Solutions Manual il
a) Because this question asks whether dealership profits will go up or down (and by how il il il il il il il il il il il il il il
much) – but refrains from inquiring as to whether this would be a good thing – it is an
il il il il il il il il il il il il il il il il il il il
example of positive analysis.
il il il il
b) Onthe other hand, this question asks whether it is desirable to impose taxes on
il il il il il il il il il il il il il il
Internet sales, so it is normative analysis. Notably, this question does not ask
il il il il il il il i l il il il il il
what the effect of such taxes would be.
il il il il il il il il
Solutions to Problems il il
1.1 Discuss the following statement: ―Sincesupply and demand curves are always il il il il il il il il il il
shifting, markets never actually reach an equilibrium. Therefore, the concept of
il il il il il il il il il il il
equilibrium is useless.‖
il il il
While the claim that markets never reach an equilibrium is probably debatable, even if markets do
il il il il il il il il il il il il il il il
not ever reach equilibrium, the concept is still of central importance. The concept of equilibrium is
il il il il il il il il il il il i l il il il il
important because it provides a simple way to predict how market prices and quantities will change
il il il il il il il il il il il il il il il il
as exogenous variables change. Thus, while we may never reach a particular equilibrium price, say
il il il il i l il il il il il il il il il il
because a supply or demand schedule shifts as the market moves toward equilibrium, we can predict
il il il il il il il il il il il il il il il il
with relative ease, for example, whether prices will be rising or falling when exogenous market
il il il il il il il il il il il il il il il
factors change as we move toward equilibrium. As exogenous variables continue to change, we
il il il il il il il i l il il il il il il
can continue to predict the direction of change for the endogenous variables, and this is not
il il il il il il il il il il il il il il il il
“useless.”
il
1.2 In an article entitled, ―Corn Prices Surge on Export Demand, Crop Data,‖ The Wall
il il il il il il il il il il il il il
Street Journal identified several exogenous shocks that pushed U.S. corn prices sharply
il il il il il il il il il il il il
higher.(See the article by Aaron Lucchetti, August 22, 1997, p. C17. on national income.) Suppose the U.S.
il il il il il il il il il il il il il il il il il
market for corn is competitive, with an upward-sloping supply curve and a downward-
il il il il il il il il il il il il il
sloping demand curve. For each of the following scenarios, illustrate graphically how the
il il il il il il il il il il il il il
exogenous event described will contribute to a higher price of corn in the U.S. market.
il il il il il il il il il il il il il il il
a) The U.S. Department of Agriculture announces that exports of corn to Taiwan and
il il il il il il il il il il il il
Japan were ―surprisingly bullish,‖ around 30 percent higherthan had been expected.
il il il il il il il il il il il il
b) Some analysts project that the size of the U.S. corn crop will hit a six-year low because of dry
il il il il il il il il il il il il il il il il il il
weather.
il
c) The strengthening of El Niño, the meteorological trend that brings warmer weather to the
il il il il il il il il il il il il il
western coast of South America, reduces corn production outside the United States,
il il il il il il il il il il il il
thereby increasing foreign countries’ dependence on the U.S. corn crop.
il il il il il il il il il il
Copyright © 2014 John Wiley& Sons, Inc. il il il il il il il Chapter 1 - 3 il il il
, Besanko &Braeutigam – Microeconomics, 5th edition
il il il il il il Solutions Manual il
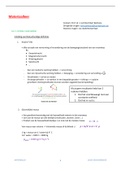
a) Surprisingly high export sales mean that the demand for corn was higher than il il il il il il il il il il il il
expected, at D2 rather than D1.
il il il i l il il
P
S
P2
i l
P1
D2
D1
Q
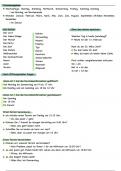
b) Dryweather would reduce the supply of corn, to S2 rather than S1.
il il il il il il il il il i l il il
S2
P
S1
P2
P1
D
Q
c) Assuming the U.S. does not import corn, reduced production outside the U.S. il il il il il il il il il il il
would not impact U.S. corn market supply. El Nino would, however, cause
il il il il il il il i l il il il il
demand for U.S. cornto shift out, the figure being the same as in part (a) above.
il il il il il il il il il il il il il il il il il
1.3 In early 2008, the price of oil on the world market increased, hitting a peak of about
il il il il il il il il il il il il il il il il
$140 per barrel in July, 2008. In the second half of 2008, the price of oil declined, ending the
il il il il il il il il il il il il il il il il il il
year at just over $40 per barrel. Suppose that the global market for oil can be described by an
il il il il il il il il il il il il il il il il il il il
upward-sloping supply curve and a downward-sloping demand curve. For each of the
il il il il il il il il il il il il
following scenarios, illustrate graphically how the exogenous event contributed to a rise or a
il il il il il il il il il il il il il il
decline in the price of oil in 2008:
il il il il il il il il
Copyright © 2014 John Wiley& Sons, Inc.
il il il il il il il Chapter 1 - 4 il il il
il il il il il il Solutions Manual il
Chapter1 il
AnalyzingEconomicProblems il il
Solutions to Review Questions il il il
1. What is the difference between microeconomics and macroeconomics? il il il il il il il
Microeconomics studies the economic behavior ofindividualeconomic decision makers, suchas a il il il il il il il il il il il il
consumer, a worker, a firm, or a manager. Macroeconomics studies how an entire national
il il il il il il il il i l il il il il il
economy performs, examining such topics as the aggregate levels of income and employment, the
il il il il il il il il il il il il il il
levels of interest rates and prices, the rate of inflation, and the nature of business cycles.
il il il il il il il il il il il il il il il il
2. Why is economics often described as the science of constrained choice?
il il il il il il il il il il
While our wants for goods and services are unlimited, the resources necessary to produce those
il il il il il il il il il il il il il il
goods and services, such as labor, managerial talent, capital, and raw materials, are “scarce” because
il il il il il il il il il il il il il il il
their supply is limited. This scarcity implies that we are constrained in the choices we can make
il il il il i l il il il il il il il il il il il il
about which goods and services to produce. Thus, economics is often described as the science of
il il il il il il il i l il il il il il il il il
constrained choice.
il il
3. How does thetool of constrained optimization help decision makers make choices? il il il il il il il il il il il
What roles do the objective function and constraints play in a model of constrained
il il il il il il il il il il il il il il
optimization?
il
Constrained optimization allows the decision maker to select the best (optimal) alternative while il il il il il il il il il il il il
accounting for any possible limitations or restrictions on the choices. The objective function
il il il il il il il il il il i l il il
represents the relationship to be maximized or minimized. For example, a firm‟s profit might be the
il il il il il il il il i l il il il il il il il
objective function and all choices will be evaluated in the profit function to determine which yields
il il il il il il il il il il il il il il il il
the highest profit. The constraints place limitations on the choice the decision maker can select and
il il il i l il il il il il il il il il il il il
defines the set of alternatives from which the best will be chosen.
il il il il il il il il il il il il
4. Suppose the market forwheat is competitive, with an upward-sloping supply curve, a il il il il il il il il il il il il
downward-sloping demand curve, and an equilibrium price of $4.00 per bushel. Why would a
il il il il il il il il il il il il il il
higher price (e.g., $5.00 per bushel) not be an equilibrium price? Why would a lower price
il il il il il il il il il il il il il il il il
(e.g., $2.50 per bushel) not be an equilibrium price?
il il il il il il il il il
If the price in the market was above the equilibrium price, consumers would be willing to purchase
il il il il il il il il il il il il il il il il
fewer units than suppliers would be willing to sell, creating an excess supply. As suppliers realize
il il il il il il il il il il il il il i l il il
theyare not selling the units they have made available, sellers will bid down the
il il il il il il il il il il il il il il il
Copyright © 2014 John Wiley& Sons, Inc. il il il il il il il Chapter 1 - 1 il il il
,Besanko &Braeutigam – Microeconomics, 5th edition il il il il il il Solutions Manual il
price to entice more consumers to purchase their goods or services. By definition, equilibrium is a
il il il il il il il il il il i l il il il il
state that will remain unchanged as long as exogenous factors remain unchanged. Since in this case
il il il il il il il il il il il il i l il il il
suppliers will lower their price, this high price cannot be an equilibrium.
il il il il il il il il il il il il
When the price is below the equilibrium price, consumers will demand more units than suppliers have
il il il il il il il il il il il il il il il
made available. This excess demand will entice consumers to bid up the prices to purchase the
il il i l il il il il il il il il il il il il il
limited units available. Since the price will change, it cannot be an equilibrium.
il il il i l il il il il il il il il il
5. What isthe difference between an exogenous variable and an endogenous variable in il il il il il il il il il il il il
an economic model? Would it ever be useful to construct a model that contained only
il il il il il il il il il il il il il il il
exogenous variables (and no endogenous variables)?
il il il il il il
Exogenous variables are taken as given in an economic model, i.e., theyare determined by some il il il il il il il il il il il il il il il
process outside the model, while endogenous variables are determined within the economic model
il il il il il il il il il il il il il
being studied.
il il
An economic model that contained no endogenous variables would not be very interesting. With no
il il il il il il il il il il il il i l il
endogenous variables, nothing would be determined by the model so it would not serve much
il il il il il il il il il il il il il il il
purpose.
il
6. Why do economists do comparative statics analysis? What role do endogenous il il il il il il il il il il
variables and exogenous variables play in comparative statics analysis?
il il il il il il il il il
Comparative statics analyses are performed to determine how the levels of endogenous variables il il il il il il il il il il il il
change as some exogenous variable is changed. This type of analysis is very important since in the
il il il il il il il i l il il il il il il il il il
real world the exogenous variables, such as weather, policy tools, etc. are always changing and it is
il il il il il il il il il il il il il il il il il
useful to know how changes in these variables affect the levels of other, endogenous, variables. An
il il il il il il il il il il il il il il il i l
example of comparative statics analysis would be asking the question: If extraordinarily low rainfall
il il il il il il il il il il il il il il
(an exogenous variable) causes a 30 percent reduction in corn supply, by how much will the market
il il il il il il il il il il il il il il il il il
price for corn (an endogenous variable) increase?
il il il il il il il
7. What isthe difference between positive and normative analysis? Which of the il il il il il il il il il il il
following questions would entail positive analysis, and which normative analysis?
il il il il il il il il il il
a) What effect will Internet auction companieshave on the profits of local automobile
il il il il il il il il il il il il
dealerships?
il
b) Should the government impose special taxes on sales of merchandise made over the il il il il il il il il il il il il
Internet?
il
Positive analysis attempts to explain how an economic system works or to predict how it will change
il il il il il il il il il il il il il il il il
over time byasking explanatoryor predictive questions. Normative analysis focuses on what should
il il il il il il il il i l il il il il il
be done by asking prescriptive questions.
il il il il il il
Copyright © 2014 John Wiley& Sons, Inc. il il il il il il il Chapter 1 - 2 il il il
,Besanko &Braeutigam – Microeconomics, 5th edition
il il il il il il Solutions Manual il
a) Because this question asks whether dealership profits will go up or down (and by how il il il il il il il il il il il il il il
much) – but refrains from inquiring as to whether this would be a good thing – it is an
il il il il il il il il il il il il il il il il il il il
example of positive analysis.
il il il il
b) Onthe other hand, this question asks whether it is desirable to impose taxes on
il il il il il il il il il il il il il il
Internet sales, so it is normative analysis. Notably, this question does not ask
il il il il il il il i l il il il il il
what the effect of such taxes would be.
il il il il il il il il
Solutions to Problems il il
1.1 Discuss the following statement: ―Sincesupply and demand curves are always il il il il il il il il il il
shifting, markets never actually reach an equilibrium. Therefore, the concept of
il il il il il il il il il il il
equilibrium is useless.‖
il il il
While the claim that markets never reach an equilibrium is probably debatable, even if markets do
il il il il il il il il il il il il il il il
not ever reach equilibrium, the concept is still of central importance. The concept of equilibrium is
il il il il il il il il il il il i l il il il il
important because it provides a simple way to predict how market prices and quantities will change
il il il il il il il il il il il il il il il il
as exogenous variables change. Thus, while we may never reach a particular equilibrium price, say
il il il il i l il il il il il il il il il il
because a supply or demand schedule shifts as the market moves toward equilibrium, we can predict
il il il il il il il il il il il il il il il il
with relative ease, for example, whether prices will be rising or falling when exogenous market
il il il il il il il il il il il il il il il
factors change as we move toward equilibrium. As exogenous variables continue to change, we
il il il il il il il i l il il il il il il
can continue to predict the direction of change for the endogenous variables, and this is not
il il il il il il il il il il il il il il il il
“useless.”
il
1.2 In an article entitled, ―Corn Prices Surge on Export Demand, Crop Data,‖ The Wall
il il il il il il il il il il il il il
Street Journal identified several exogenous shocks that pushed U.S. corn prices sharply
il il il il il il il il il il il il
higher.(See the article by Aaron Lucchetti, August 22, 1997, p. C17. on national income.) Suppose the U.S.
il il il il il il il il il il il il il il il il il
market for corn is competitive, with an upward-sloping supply curve and a downward-
il il il il il il il il il il il il il
sloping demand curve. For each of the following scenarios, illustrate graphically how the
il il il il il il il il il il il il il
exogenous event described will contribute to a higher price of corn in the U.S. market.
il il il il il il il il il il il il il il il
a) The U.S. Department of Agriculture announces that exports of corn to Taiwan and
il il il il il il il il il il il il
Japan were ―surprisingly bullish,‖ around 30 percent higherthan had been expected.
il il il il il il il il il il il il
b) Some analysts project that the size of the U.S. corn crop will hit a six-year low because of dry
il il il il il il il il il il il il il il il il il il
weather.
il
c) The strengthening of El Niño, the meteorological trend that brings warmer weather to the
il il il il il il il il il il il il il
western coast of South America, reduces corn production outside the United States,
il il il il il il il il il il il il
thereby increasing foreign countries’ dependence on the U.S. corn crop.
il il il il il il il il il il
Copyright © 2014 John Wiley& Sons, Inc. il il il il il il il Chapter 1 - 3 il il il
, Besanko &Braeutigam – Microeconomics, 5th edition
il il il il il il Solutions Manual il
a) Surprisingly high export sales mean that the demand for corn was higher than il il il il il il il il il il il il
expected, at D2 rather than D1.
il il il i l il il
P
S
P2
i l
P1
D2
D1
Q
b) Dryweather would reduce the supply of corn, to S2 rather than S1.
il il il il il il il il il i l il il
S2
P
S1
P2
P1
D
Q
c) Assuming the U.S. does not import corn, reduced production outside the U.S. il il il il il il il il il il il
would not impact U.S. corn market supply. El Nino would, however, cause
il il il il il il il i l il il il il
demand for U.S. cornto shift out, the figure being the same as in part (a) above.
il il il il il il il il il il il il il il il il il
1.3 In early 2008, the price of oil on the world market increased, hitting a peak of about
il il il il il il il il il il il il il il il il
$140 per barrel in July, 2008. In the second half of 2008, the price of oil declined, ending the
il il il il il il il il il il il il il il il il il il
year at just over $40 per barrel. Suppose that the global market for oil can be described by an
il il il il il il il il il il il il il il il il il il il
upward-sloping supply curve and a downward-sloping demand curve. For each of the
il il il il il il il il il il il il
following scenarios, illustrate graphically how the exogenous event contributed to a rise or a
il il il il il il il il il il il il il il
decline in the price of oil in 2008:
il il il il il il il il
Copyright © 2014 John Wiley& Sons, Inc.
il il il il il il il Chapter 1 - 4 il il il