Matlab overzicht
Inhoud
Algemeen .................................................................................................................................................................2
Plotten .................................................................................................................................................................2
Programmeren ....................................................................................................................................................3
Functies: ..............................................................................................................................................................3
Taylorreeksen: .....................................................................................................................................................3
(inverse) Laplace, dirac en eenheidsstap ............................................................................................................3
Matrices, vectors en stelsels ...............................................................................................................................4
Statistiek ..................................................................................................................................................................5
Verdelingsfuncties en normaliteit testen ............................................................................................................5
T-testen................................................................................................................................................................5
Crosstab ...............................................................................................................................................................5
ANOVA .................................................................................................................................................................6
Regressie..............................................................................................................................................................6
Correlatiecoëfficient: ...........................................................................................................................................7
,Matlab overzicht
Algemeen
Output getallen wijzigen: format short format long (E erna: scientific notation bv. shortE)
10
! log(x) is in matlab log10(x) , ln(x) is in matlab log(x)
4 constante getallen: pi, j=i (j²=-1), Inf (∞), NaN (not a number)
“ans” heeft de waarde van de laatste uitkomst
Plotten
Assenstelsels tekenen:
Titel toevoegen: title(‘Plot of the Sine function’)
Assen labelen: xlabel('X1') ylabel('Y') zlabel('Z')
Instellen waar lijntjes staan op x-as: xticks([1:6]) (zet hier op 1,2,..,6 een streepje)
Labels aan streepjes instellen: xticklabels({"januari","februari","maart","april","mei","juni"})
Legende: legend('reclame','omzet') (eerst getekend = eerst benoemen)
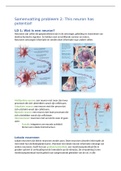
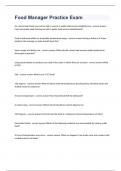
Gewone plot: plot(X,Y,LineSpec) Linespec: LineStyle, Marker, Color, …
Attributes overzicht:
Andere grafieken:
Parameterkrommen: plot( f1,f2) bv. t=0:0.01:2*pi; plot(cos(2*t), sin(5*t))
Plotten van functie: fplot(f); met bv. f= @(x) sqrt((25-x.^2)/5)
Plotten van functie in x&y: fimplicit(f) met bv. f = @(x,y) x.^2 + y.^2 - 3;
Boxplot: boxplot(X) interkwartiel = iqr(A), percentiel = prctil(A,10)
Scatterplot: scatter(x1,y)
Histogram: histogram(R,n) met n aantal staven, kan weggelaten worden
Polarplot: bv. tt = -2:0.01:0; polarplot(tt,acos(tt+1));
Mesh: [X,Y]=meshgrid(x,y);* Z = sin(X)+sin(Y); mesh(X,Y,Z)
Contour: [X,Y]=meshgrid(x,y);* Z=… contour(X,Y,Z)
* met x en y bv -10:0.5:10 afhankelijk van stappen (hier 0.5) dichter of minder dicht op elkaar
Tools: axis equal hold on hold off
, Programmeren
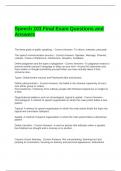
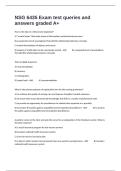
If … elseif … else … end en for … end
Voorbeeld:
Logische operators: > < >= <= == ~= (not equal) &(AND) |(OR) ~(NOT)
Som operator: bv symsum(factorial(i), i, 0, 10) %4037914
Functies:
(Voor stelsels oplossen en nulpunten zoeken, zie onderaan matrices)
Bij y = sin(x) is x in radialen. Bij y = sind(x) is x in graden (analoog voor andere functies) examen 2020 eerste zit
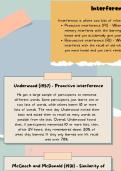
Asymptoten zoeken:
VA: solve(limit(@(x)f,x,a)==Inf,x)
HA:
o1 = limit(f19/x,x,Inf);
b1 = limit(f19-o1*x,x,Inf);
o1*x + b1 %SA voor x-> +inf
Limieten:
Linkerlimiet: limit(F,x, 1, 'left') %in x=1 rechterlimiet analoog
Bv. zoeken waar afgeleide 2 is:
Afg = diff(F(x),x);
vpasolve(Afg==2,x)
Oppervlakte tussen 2 functies: zoek snijpunten (bv. 0 en 4) int(f1(x)-f2(x),0,4)
Y-waarde zoeken bij een bepaalde x-waarde:
Indien functie zonder functie handler: f1 = (x.^2/2); subs(f1,x,1)
Indien met function handler: f1 = @(x) (x.^2/2); yco = f1(xco)
Dubbele integraal (bv voor volume berekenen):
int(int(4,-sqrt(2*x-x^2),sqrt(2*x-x^2)),0,2) %2 ints in elkaar oef 24
Snijpunten zoeken:
1ste manier:
x1 = solve(f1(x)-f2(x)==0,x)
f2(x1) %y-co vinden
de
2 manier:
F = @(x)[x(1).^2 + 5*x(2).^2-25; x(1)+x(2)-2];
fsolve(F, [-1,2]) %schatting voor punten
Je kan aan solve ook voorwaarde meegeven, bv: opl = solve([diff(r(t),t)==0, 0<=t<=2*pi],t)
!!! Dat is belangrijk, soms krijg je anders niet alle resultaten.
Taylorreeksen:
Bv. Taylorontwikkeling rond x=1, afgekapt na term in x: t = taylor(f,x,1, 'Order',2)
(inverse) Laplace, dirac en eenheidsstap
ilaplace(f) of laplace(f) Diracfunctie = dirac(t) eenheidsstap: heaviside(x)
Inhoud
Algemeen .................................................................................................................................................................2
Plotten .................................................................................................................................................................2
Programmeren ....................................................................................................................................................3
Functies: ..............................................................................................................................................................3
Taylorreeksen: .....................................................................................................................................................3
(inverse) Laplace, dirac en eenheidsstap ............................................................................................................3
Matrices, vectors en stelsels ...............................................................................................................................4
Statistiek ..................................................................................................................................................................5
Verdelingsfuncties en normaliteit testen ............................................................................................................5
T-testen................................................................................................................................................................5
Crosstab ...............................................................................................................................................................5
ANOVA .................................................................................................................................................................6
Regressie..............................................................................................................................................................6
Correlatiecoëfficient: ...........................................................................................................................................7
,Matlab overzicht
Algemeen
Output getallen wijzigen: format short format long (E erna: scientific notation bv. shortE)
10
! log(x) is in matlab log10(x) , ln(x) is in matlab log(x)
4 constante getallen: pi, j=i (j²=-1), Inf (∞), NaN (not a number)
“ans” heeft de waarde van de laatste uitkomst
Plotten
Assenstelsels tekenen:
Titel toevoegen: title(‘Plot of the Sine function’)
Assen labelen: xlabel('X1') ylabel('Y') zlabel('Z')
Instellen waar lijntjes staan op x-as: xticks([1:6]) (zet hier op 1,2,..,6 een streepje)
Labels aan streepjes instellen: xticklabels({"januari","februari","maart","april","mei","juni"})
Legende: legend('reclame','omzet') (eerst getekend = eerst benoemen)
Gewone plot: plot(X,Y,LineSpec) Linespec: LineStyle, Marker, Color, …
Attributes overzicht:
Andere grafieken:
Parameterkrommen: plot( f1,f2) bv. t=0:0.01:2*pi; plot(cos(2*t), sin(5*t))
Plotten van functie: fplot(f); met bv. f= @(x) sqrt((25-x.^2)/5)
Plotten van functie in x&y: fimplicit(f) met bv. f = @(x,y) x.^2 + y.^2 - 3;
Boxplot: boxplot(X) interkwartiel = iqr(A), percentiel = prctil(A,10)
Scatterplot: scatter(x1,y)
Histogram: histogram(R,n) met n aantal staven, kan weggelaten worden
Polarplot: bv. tt = -2:0.01:0; polarplot(tt,acos(tt+1));
Mesh: [X,Y]=meshgrid(x,y);* Z = sin(X)+sin(Y); mesh(X,Y,Z)
Contour: [X,Y]=meshgrid(x,y);* Z=… contour(X,Y,Z)
* met x en y bv -10:0.5:10 afhankelijk van stappen (hier 0.5) dichter of minder dicht op elkaar
Tools: axis equal hold on hold off
, Programmeren
If … elseif … else … end en for … end
Voorbeeld:
Logische operators: > < >= <= == ~= (not equal) &(AND) |(OR) ~(NOT)
Som operator: bv symsum(factorial(i), i, 0, 10) %4037914
Functies:
(Voor stelsels oplossen en nulpunten zoeken, zie onderaan matrices)
Bij y = sin(x) is x in radialen. Bij y = sind(x) is x in graden (analoog voor andere functies) examen 2020 eerste zit
Asymptoten zoeken:
VA: solve(limit(@(x)f,x,a)==Inf,x)
HA:
o1 = limit(f19/x,x,Inf);
b1 = limit(f19-o1*x,x,Inf);
o1*x + b1 %SA voor x-> +inf
Limieten:
Linkerlimiet: limit(F,x, 1, 'left') %in x=1 rechterlimiet analoog
Bv. zoeken waar afgeleide 2 is:
Afg = diff(F(x),x);
vpasolve(Afg==2,x)
Oppervlakte tussen 2 functies: zoek snijpunten (bv. 0 en 4) int(f1(x)-f2(x),0,4)
Y-waarde zoeken bij een bepaalde x-waarde:
Indien functie zonder functie handler: f1 = (x.^2/2); subs(f1,x,1)
Indien met function handler: f1 = @(x) (x.^2/2); yco = f1(xco)
Dubbele integraal (bv voor volume berekenen):
int(int(4,-sqrt(2*x-x^2),sqrt(2*x-x^2)),0,2) %2 ints in elkaar oef 24
Snijpunten zoeken:
1ste manier:
x1 = solve(f1(x)-f2(x)==0,x)
f2(x1) %y-co vinden
de
2 manier:
F = @(x)[x(1).^2 + 5*x(2).^2-25; x(1)+x(2)-2];
fsolve(F, [-1,2]) %schatting voor punten
Je kan aan solve ook voorwaarde meegeven, bv: opl = solve([diff(r(t),t)==0, 0<=t<=2*pi],t)
!!! Dat is belangrijk, soms krijg je anders niet alle resultaten.
Taylorreeksen:
Bv. Taylorontwikkeling rond x=1, afgekapt na term in x: t = taylor(f,x,1, 'Order',2)
(inverse) Laplace, dirac en eenheidsstap
ilaplace(f) of laplace(f) Diracfunctie = dirac(t) eenheidsstap: heaviside(x)