Topic 2: Equity exam questions
2021-2022 question:
a) Define the concept of vertical equity in health care finance, considering both normative and
positive dimensions. Describe and critically appraise the empirical evidence, both in approach and
findings, that measures and compares the degree of vertical equity in health care finance across
health care systems.
Vertical equity in healthcare financing refers how equitable contributions to healthcare financing are,
where individuals with an unequal ability to pay should contribute differently to healthcare financing.
The normative view is a judgment about how an individual’s access to healthcare should not depend
on an individual’s income and typically, high-income individuals should contribute proportionally
more than low-income individuals. The positive view of vertical equity deals with the measurement
of equity and comparisons of vertical equity in different economies, typically performed in empirical
studies using the Kakwani progressivity index. This is twice the area between the payment
concentration curve (concentration index of healthcare payments) and the Lorenz curve for pre-
payment income (GINI coefficient of pre-payment income). This indicates the progressivity of a
system, where a Kakwani index above 0 indicates progressivity and a Kakwani index below 0 indicates
regressivity. This index typically varies between -2 (entire tax burden is concentrated on the poorest
individual) and +1 (entire tax burden is concentrated on the richest person). This depends on the
financing mechanisms used by systems, such as taxation, social insurance contributions, private
insurance and out-of-pocket payments. While most economies strive for a progressive system in
which low-income individuals contribute proportionally less than high-income individuals, many
economies display regressivity in healthcare financing.
(Wagstaff and Doorslaer, 2000) use a cross-national comparison of the progressivity of healthcare
financing in 12 OECD economies to find their degree of vertical equity. They adopt a common
equivalence scale to eliminate cross-country differences, making progressivity comparisons more
reliable. They use household and family surveys, with their unit of analysis being at the household
level, however, an individual level comparison may be preferred. This is because household income
can skew results, as members with different incomes contribute differently to the healthcare system,
which may not be evident in the data. Nonetheless, the household level enables comparisons with
other countries who share the same unit of analysis. Another limitation of their method is that they
have different sample sizes for each country. They collect 42,982 unweighted samples for Germany,
7000 unweighted samples for the UK and 23,573 weighted samples for the US. This lack of
consistency in their methodology between each economy may yield unreliable results in determining
the progressivity of an economy.
Using the Kakwani (1977) index, they find that most economies show progressivity. The UK system
shows strong vertical equity as the Kakwani index is 0.0518. This is because the UK’s healthcare
financing mostly comes from a high share of general taxes which is a progressive payment form. Also,
their social insurance system is via National Insurance contributions, collected on an individual’s
earnings and there is an exception for low-income earners. This makes the UK healthcare finance
system progressive. However, the US system is regressive with a Kakwani index of – 0.1303. This is
because they have a higher share of out-of-pocket payments than other economies and rely mostly
on private insurance to fund their system, which is a regressive payment form since premiums
depend on an individual’s risk. Germany is also a regressive system, indicated by a Kakwani Index of –
0.0452. While Germany is a social insurance system with contributions depending on an individual’s
income, high income earners are excluded from the compulsory funds due to income ceilings. They
, also have a high share of out-of-pocket payments that represent a higher share of a poor household’s
income, making Germany’s healthcare financing system regressive. Therefore, they find that
countries who predominantly have a tax-financed system (UK) display greater vertical equity than
countries that rely on social insurance and private financing (Germany and US). However, the study
focuses only on the progressivity of healthcare payments and fails to identify the factors influencing
this distribution. There may be a reason other than inequity as to why the poor contribute more than
the rich, but this has not been identified.
b) Define the concept of horizontal equity in access to care. Using concentration curves, represent
graphically a situation of pro-poor inequity in health care utilisation. Explain the key features of
your diagram. Briefly discuss the evidence on inequity in access to care in European health care
systems.
Horizontal equity in access to care refers to the idea that individuals with equal need should receive
equal health care treatment, regardless of their socioeconomic status or other factors such as race
and gender. Horizontal equity can be measured by using the Horizontal Inequity index (HI) method
with the use of concentration curves. Firstly, CC m is computed for the observed medical expenditure
which shows the level of inequality before standardising for needs. Then, CC n is computed for the
predicted medical expenditure to show the level of inequality after needs have been standardised.
The inequity in medical care utilisation is given by twice the area between the two curves:
1
HI =2∫ [CC n ( p ) −¿ CC m ( p ) ]dp=CI m−CI n ¿
0
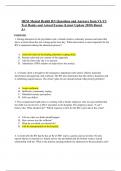
If the HI index is smaller (greater) than 0, there is evidence of pro-poor inequity (pro-rich inequity).
Pro-poor inequity can be shown on a diagram:
Concentration Curve for medical care expenditures
(CC m ) and need standardised expenditure
1.0 (CC n )
0.98 Predicted medical
0.96
expenditures (CC n )
Actual medical
expenditures (CC m )
0.59
0.5
Cumulative
proportion of
medical care
expenditure
0.0 1.0
0.0 0.3 0.7
Cumulative proportion of sample, p, ranked by income
2021-2022 question:
a) Define the concept of vertical equity in health care finance, considering both normative and
positive dimensions. Describe and critically appraise the empirical evidence, both in approach and
findings, that measures and compares the degree of vertical equity in health care finance across
health care systems.
Vertical equity in healthcare financing refers how equitable contributions to healthcare financing are,
where individuals with an unequal ability to pay should contribute differently to healthcare financing.
The normative view is a judgment about how an individual’s access to healthcare should not depend
on an individual’s income and typically, high-income individuals should contribute proportionally
more than low-income individuals. The positive view of vertical equity deals with the measurement
of equity and comparisons of vertical equity in different economies, typically performed in empirical
studies using the Kakwani progressivity index. This is twice the area between the payment
concentration curve (concentration index of healthcare payments) and the Lorenz curve for pre-
payment income (GINI coefficient of pre-payment income). This indicates the progressivity of a
system, where a Kakwani index above 0 indicates progressivity and a Kakwani index below 0 indicates
regressivity. This index typically varies between -2 (entire tax burden is concentrated on the poorest
individual) and +1 (entire tax burden is concentrated on the richest person). This depends on the
financing mechanisms used by systems, such as taxation, social insurance contributions, private
insurance and out-of-pocket payments. While most economies strive for a progressive system in
which low-income individuals contribute proportionally less than high-income individuals, many
economies display regressivity in healthcare financing.
(Wagstaff and Doorslaer, 2000) use a cross-national comparison of the progressivity of healthcare
financing in 12 OECD economies to find their degree of vertical equity. They adopt a common
equivalence scale to eliminate cross-country differences, making progressivity comparisons more
reliable. They use household and family surveys, with their unit of analysis being at the household
level, however, an individual level comparison may be preferred. This is because household income
can skew results, as members with different incomes contribute differently to the healthcare system,
which may not be evident in the data. Nonetheless, the household level enables comparisons with
other countries who share the same unit of analysis. Another limitation of their method is that they
have different sample sizes for each country. They collect 42,982 unweighted samples for Germany,
7000 unweighted samples for the UK and 23,573 weighted samples for the US. This lack of
consistency in their methodology between each economy may yield unreliable results in determining
the progressivity of an economy.
Using the Kakwani (1977) index, they find that most economies show progressivity. The UK system
shows strong vertical equity as the Kakwani index is 0.0518. This is because the UK’s healthcare
financing mostly comes from a high share of general taxes which is a progressive payment form. Also,
their social insurance system is via National Insurance contributions, collected on an individual’s
earnings and there is an exception for low-income earners. This makes the UK healthcare finance
system progressive. However, the US system is regressive with a Kakwani index of – 0.1303. This is
because they have a higher share of out-of-pocket payments than other economies and rely mostly
on private insurance to fund their system, which is a regressive payment form since premiums
depend on an individual’s risk. Germany is also a regressive system, indicated by a Kakwani Index of –
0.0452. While Germany is a social insurance system with contributions depending on an individual’s
income, high income earners are excluded from the compulsory funds due to income ceilings. They
, also have a high share of out-of-pocket payments that represent a higher share of a poor household’s
income, making Germany’s healthcare financing system regressive. Therefore, they find that
countries who predominantly have a tax-financed system (UK) display greater vertical equity than
countries that rely on social insurance and private financing (Germany and US). However, the study
focuses only on the progressivity of healthcare payments and fails to identify the factors influencing
this distribution. There may be a reason other than inequity as to why the poor contribute more than
the rich, but this has not been identified.
b) Define the concept of horizontal equity in access to care. Using concentration curves, represent
graphically a situation of pro-poor inequity in health care utilisation. Explain the key features of
your diagram. Briefly discuss the evidence on inequity in access to care in European health care
systems.
Horizontal equity in access to care refers to the idea that individuals with equal need should receive
equal health care treatment, regardless of their socioeconomic status or other factors such as race
and gender. Horizontal equity can be measured by using the Horizontal Inequity index (HI) method
with the use of concentration curves. Firstly, CC m is computed for the observed medical expenditure
which shows the level of inequality before standardising for needs. Then, CC n is computed for the
predicted medical expenditure to show the level of inequality after needs have been standardised.
The inequity in medical care utilisation is given by twice the area between the two curves:
1
HI =2∫ [CC n ( p ) −¿ CC m ( p ) ]dp=CI m−CI n ¿
0
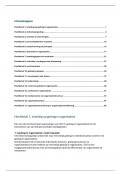
If the HI index is smaller (greater) than 0, there is evidence of pro-poor inequity (pro-rich inequity).
Pro-poor inequity can be shown on a diagram:
Concentration Curve for medical care expenditures
(CC m ) and need standardised expenditure
1.0 (CC n )
0.98 Predicted medical
0.96
expenditures (CC n )
Actual medical
expenditures (CC m )
0.59
0.5
Cumulative
proportion of
medical care
expenditure
0.0 1.0
0.0 0.3 0.7
Cumulative proportion of sample, p, ranked by income