STAT 210 Final Exam
Sampling is used heavily in manufacturing and service settings to ensure high-quality
products. In which of the following areas would sampling be inappropriate?
Computer assembly
Custom cabinet making
Cell phone manufacturing
Technical support by phone
An analyst studies a data set of the 2011 year-end book value per share for all
companies listed on the New York Stock Exchange. This data set is best described as:
timeseries data
cross-sectional data
neither timeseries nor cross-sectional data
a combination of timeseries and cross-sectional data
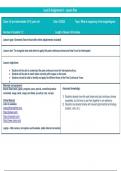
Thirty students at Eastside High School took the SAT on the same Saturday. Their raw
scores are given next.
Consider a frequency distribution of the data that groups the data in classes of 1400 up
to 1600, 1600 up to 1800 , 1800 up to 2000 and so on. What percent of students scored
less than 2200?
10%
20%
80%
90%
Use the following data to construct a scatterplot. What type of relationship is implied?
No relationship
A positive relationship
A negative relationship
Not enough information to answer
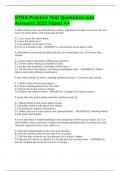
The following frequency distribution shows the frequency of the asking price, in
thousands of dollars, for current homes on the market in a particular city.
What percentage of houses has an asking price under $550,000?
50.5%
69.1%
,89.1%
95.0%
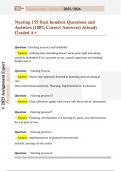
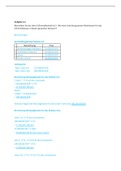
The manager at a water park constructed the following frequency distribution to
summarize attendance in July and August.
What of the following is the most likely attendance range?
2,000 up to 2,500
1,750 up to 2,000
1,000 up to 1,750
1,250 up to 1,750
Professors at a local university earn an average salary of $80,000 with a standard
deviation of $6,000. With the beginning of the next academic year, all professors will get
a 2% raise. What will be the average and the standard deviation of their new salaries?
$80,000 and $6,120
$81,600 and $6,000
$81,600 and $6,120
$82,000 and $6,200
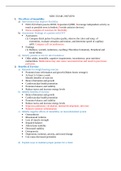
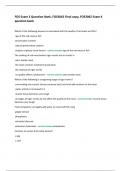
The table below gives statistics relating to a hypothetical 10-year record of two
portfolios. Assume other statistics relating to these portfolios are the same and the risk-
free rate is 3.5%. Using the coefficient of variation and the Sharpe ratio, the fund that is
preferred in terms of relative risk and return per unit of risk is:_______.
Using the coefficient of variation and the Sharpe ratio, the fund that is preferred in terms
of relative risk and return per unit of risk is _______.
Portfolio A because it has a higher coefficient of variation and a lower Sharpe ratio.
Portfolio A because it has a lower coefficient of variation and a higher Sharpe ratio.
Portfolio B because it has a higher coefficient of variation and a lower Sharpe ratio.
Portfolio B because it has a lower coefficient of variation and a higher Sharpe ratio.
Amounts spent by a sample of 200 customers at a retail store are summarized in the
following relative frequency distribution.
The mean amount spent by customers is the closest to _____.
$17.50
$20.00
$22.50
$50.00
Amounts spent by a sample of 50 customers at a retail store are summarized in the
following relative frequency distribution.
The mean amount spent by customers is the closest to_____.
, $0.36
$18.00
$20.00
$25.00
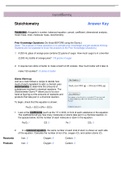
The following frequency distribution represents the number of hours studied per week
by a sample of 50 students.
The standard deviation of the number of hours studied is _____.
1.89
2.79
3.50
3.56
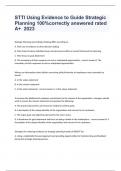
Automobiles traveling on a road with a posted speed limit of 65 miles per hour are
checked for speed by a state police radar system. The following is a frequency
distribution of speeds.
The standard deviation of this distribution is the closest to _____.
5.35
6.81
9.54
10.25
The covariance between the returns of A and B is -0.112.The standard deviation of the
rates of return is 0.26 for stock A and 0.81 for stock B. The correlation of the rates of
return between A and B is the closest to _____.
-1.88
-0.53
0.53
1.88
The covariance between the returns on two assets is negative. This occurs when...
the variance of one asset has a negative linear relationship with the variance of the
other asset
the standard deviation of one asset has a positive linear relationship with the standard
deviation of the other asset
on average, the return on one asset is below its expected value and the return on the
other asset is above its expected value
on average, the return on one asset is below its expected value and the return on the
other asset is below its expected value
Sampling is used heavily in manufacturing and service settings to ensure high-quality
products. In which of the following areas would sampling be inappropriate?
Computer assembly
Custom cabinet making
Cell phone manufacturing
Technical support by phone
An analyst studies a data set of the 2011 year-end book value per share for all
companies listed on the New York Stock Exchange. This data set is best described as:
timeseries data
cross-sectional data
neither timeseries nor cross-sectional data
a combination of timeseries and cross-sectional data
Thirty students at Eastside High School took the SAT on the same Saturday. Their raw
scores are given next.
Consider a frequency distribution of the data that groups the data in classes of 1400 up
to 1600, 1600 up to 1800 , 1800 up to 2000 and so on. What percent of students scored
less than 2200?
10%
20%
80%
90%
Use the following data to construct a scatterplot. What type of relationship is implied?
No relationship
A positive relationship
A negative relationship
Not enough information to answer
The following frequency distribution shows the frequency of the asking price, in
thousands of dollars, for current homes on the market in a particular city.
What percentage of houses has an asking price under $550,000?
50.5%
69.1%
,89.1%
95.0%
The manager at a water park constructed the following frequency distribution to
summarize attendance in July and August.
What of the following is the most likely attendance range?
2,000 up to 2,500
1,750 up to 2,000
1,000 up to 1,750
1,250 up to 1,750
Professors at a local university earn an average salary of $80,000 with a standard
deviation of $6,000. With the beginning of the next academic year, all professors will get
a 2% raise. What will be the average and the standard deviation of their new salaries?
$80,000 and $6,120
$81,600 and $6,000
$81,600 and $6,120
$82,000 and $6,200
The table below gives statistics relating to a hypothetical 10-year record of two
portfolios. Assume other statistics relating to these portfolios are the same and the risk-
free rate is 3.5%. Using the coefficient of variation and the Sharpe ratio, the fund that is
preferred in terms of relative risk and return per unit of risk is:_______.
Using the coefficient of variation and the Sharpe ratio, the fund that is preferred in terms
of relative risk and return per unit of risk is _______.
Portfolio A because it has a higher coefficient of variation and a lower Sharpe ratio.
Portfolio A because it has a lower coefficient of variation and a higher Sharpe ratio.
Portfolio B because it has a higher coefficient of variation and a lower Sharpe ratio.
Portfolio B because it has a lower coefficient of variation and a higher Sharpe ratio.
Amounts spent by a sample of 200 customers at a retail store are summarized in the
following relative frequency distribution.
The mean amount spent by customers is the closest to _____.
$17.50
$20.00
$22.50
$50.00
Amounts spent by a sample of 50 customers at a retail store are summarized in the
following relative frequency distribution.
The mean amount spent by customers is the closest to_____.
, $0.36
$18.00
$20.00
$25.00
The following frequency distribution represents the number of hours studied per week
by a sample of 50 students.
The standard deviation of the number of hours studied is _____.
1.89
2.79
3.50
3.56
Automobiles traveling on a road with a posted speed limit of 65 miles per hour are
checked for speed by a state police radar system. The following is a frequency
distribution of speeds.
The standard deviation of this distribution is the closest to _____.
5.35
6.81
9.54
10.25
The covariance between the returns of A and B is -0.112.The standard deviation of the
rates of return is 0.26 for stock A and 0.81 for stock B. The correlation of the rates of
return between A and B is the closest to _____.
-1.88
-0.53
0.53
1.88
The covariance between the returns on two assets is negative. This occurs when...
the variance of one asset has a negative linear relationship with the variance of the
other asset
the standard deviation of one asset has a positive linear relationship with the standard
deviation of the other asset
on average, the return on one asset is below its expected value and the return on the
other asset is above its expected value
on average, the return on one asset is below its expected value and the return on the
other asset is below its expected value