Module 3: demand and supply analysis
Markets and competition
Market = a group of buyers and sellers of a particular product
Competitive market = a market with many buyers and sellers, and each has a
negligible effect on price
Perfectly competitive market
All goods are exactly the same
Buyers and sellers are so numerous that no one can affect the market
price—everyone is a “price taker”
Demand
= The quantity of a commodity that a consumer is willing to buy
The law of demand= a higher price leads to a lower quantity demanded and a
lower price leads to a higher quantity demanded.
The demand schedule
= a table that shows the relationship between the price of a good and the
quantity demanded
Market demand VS individual demand
Market Qd = A Qd + B Qd + C Qd + …
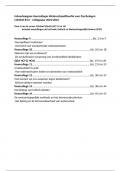
Demand curve shifters
Number of buyers (causes a movement not a shift)
o Increase increase in quantity demanded curve to the right
o Decrease decrease in quantity demanded curve to the left
Income
o Normal good (is positively related to income)
Increase in income increase in quantity demanded curve
to the right
Decrease decrease in Qd curve to the left
o Inferior goods (is negatively related to income)
Increase in income decrease in Qd curve to the left
Markets and competition
Market = a group of buyers and sellers of a particular product
Competitive market = a market with many buyers and sellers, and each has a
negligible effect on price
Perfectly competitive market
All goods are exactly the same
Buyers and sellers are so numerous that no one can affect the market
price—everyone is a “price taker”
Demand
= The quantity of a commodity that a consumer is willing to buy
The law of demand= a higher price leads to a lower quantity demanded and a
lower price leads to a higher quantity demanded.
The demand schedule
= a table that shows the relationship between the price of a good and the
quantity demanded
Market demand VS individual demand
Market Qd = A Qd + B Qd + C Qd + …
Demand curve shifters
Number of buyers (causes a movement not a shift)
o Increase increase in quantity demanded curve to the right
o Decrease decrease in quantity demanded curve to the left
Income
o Normal good (is positively related to income)
Increase in income increase in quantity demanded curve
to the right
Decrease decrease in Qd curve to the left
o Inferior goods (is negatively related to income)
Increase in income decrease in Qd curve to the left